Rising Awareness of Harassment: Insights from the 2026 Survey on Workplace Communication


Understanding Harassment Awareness in Japan
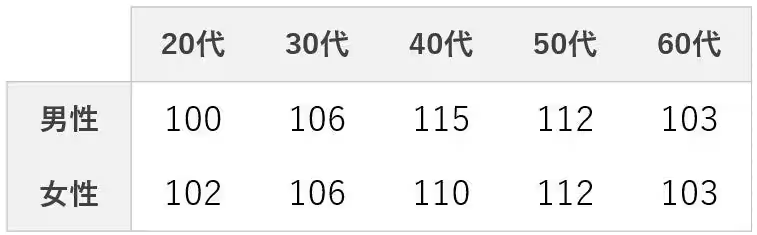
In a recent study conducted by Nihon Information Inc., significant insights into harassment awareness in the Japanese workplace have been revealed. This comprehensive survey was performed from March 18 to March 20, 2026, with a national representative sample of 1,069 employed individuals aged between 23 and 65. The findings underscore a shift in societal values regarding communication and harassment.
Key Findings of the Survey
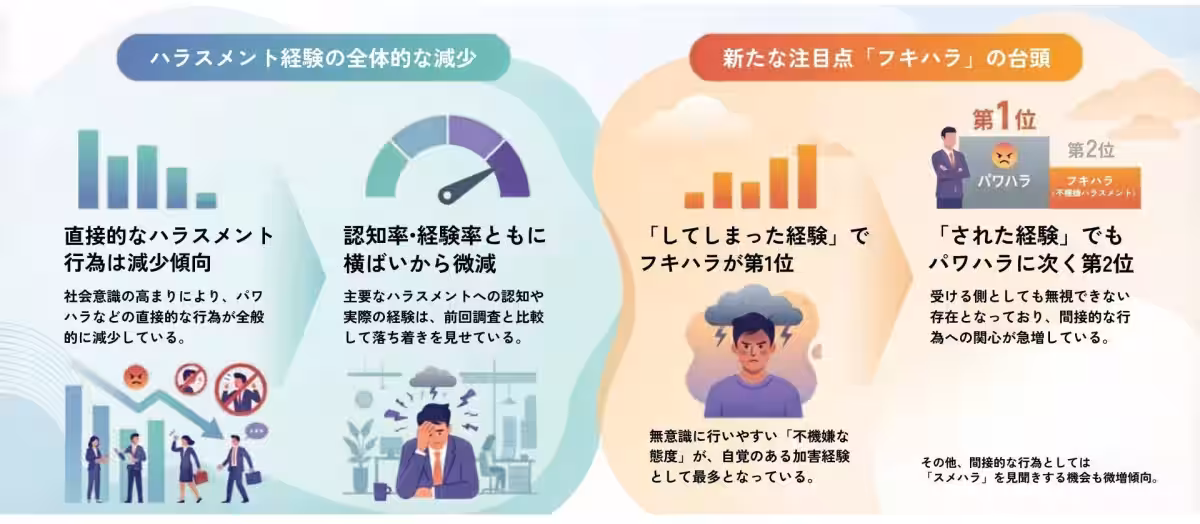
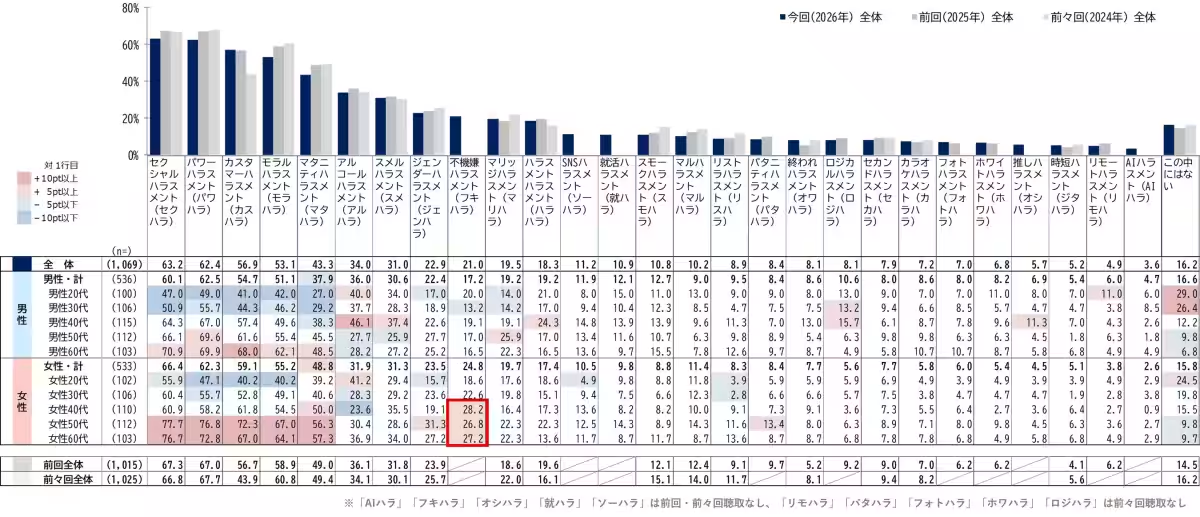
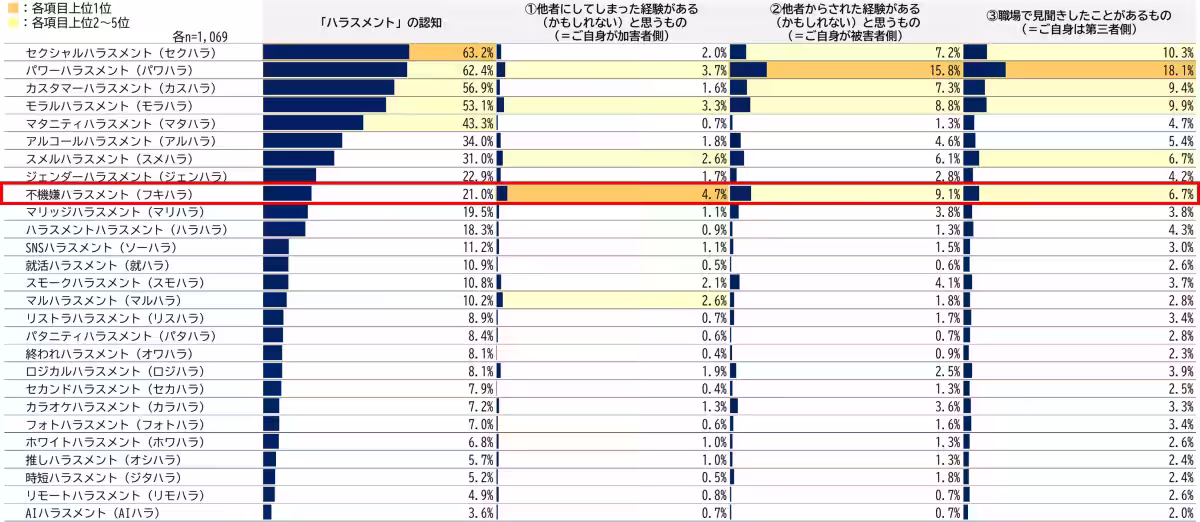
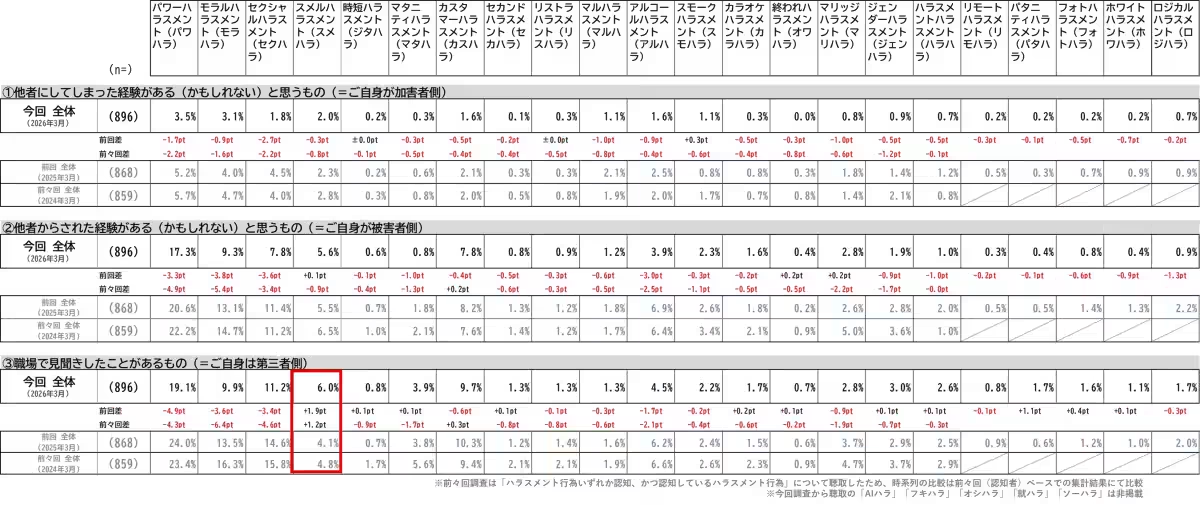
Experience of Harassment
The survey pointed out that among various types of harassment, "Fuki-hara" (blowing on someone to communicate disdain) ranked highest in reported experiences of inflicting harassment, while "Power harassment" was the second most reported by individuals who experienced harassment. Notably, overall recognition of harassment acts, such as sexual harassment, power harassment, and customer harassment, remained stable or showed a slight decrease compared to previous reports.
This indicates an evolving consciousness surrounding direct harassment behaviors, suggesting a keen awareness and growing concern for indirect forms such as "Fuki-hara" and "Sume-hara" (body odor harassment).
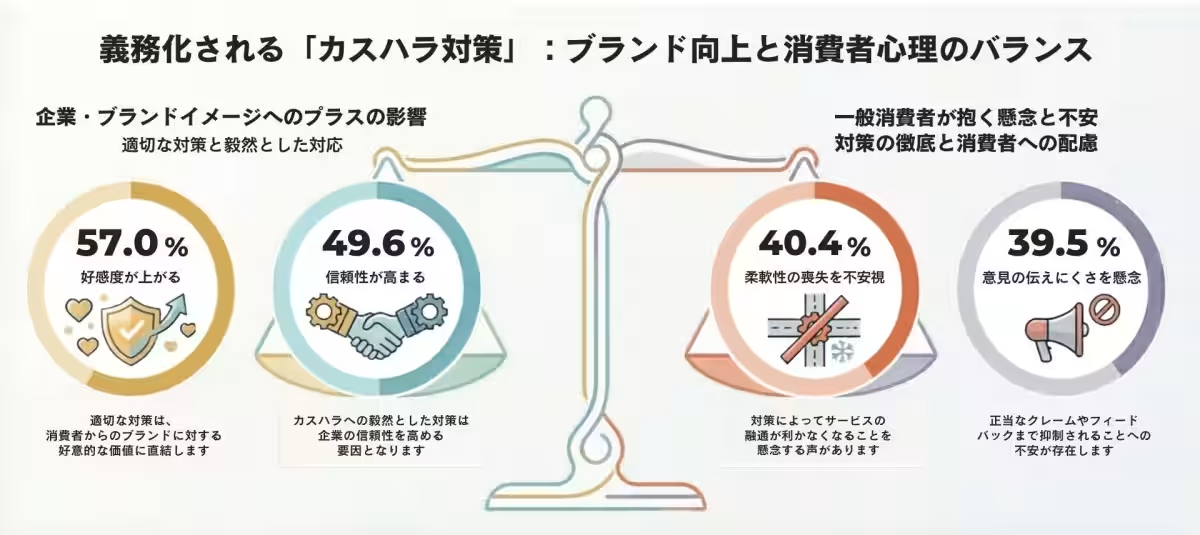
Impact of Customer Harassment Measures
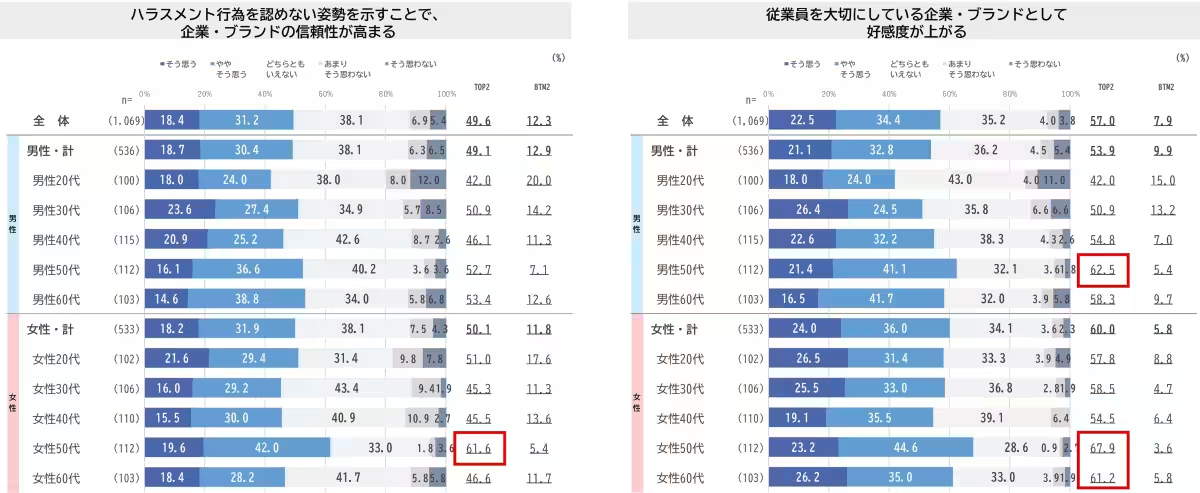
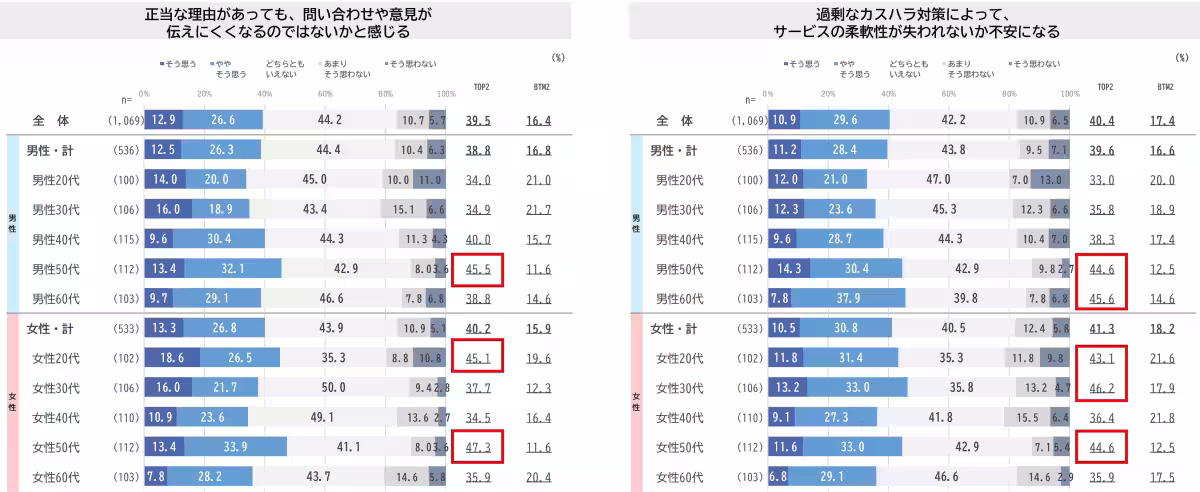
The introduction of mandatory customer harassment measures provoked noteworthy responses regarding their perceived influence on brands. Approximately 49.6% of respondents believe that implementing these measures could enhance a company's trustworthiness, while 57% feel that it would positively affect their image. Such statistics reveal an intersection between consumer concerns and corporate responsibility. However, there's a significant concern among consumers, with nearly 39.5% apprehensive that these measures may lead to difficulties in voicing complaints, and 40.4% worrying about potential loss of service flexibility. This balancing act presents a challenge for businesses that need to maintain high customer satisfaction while adopting necessary preventive measures.
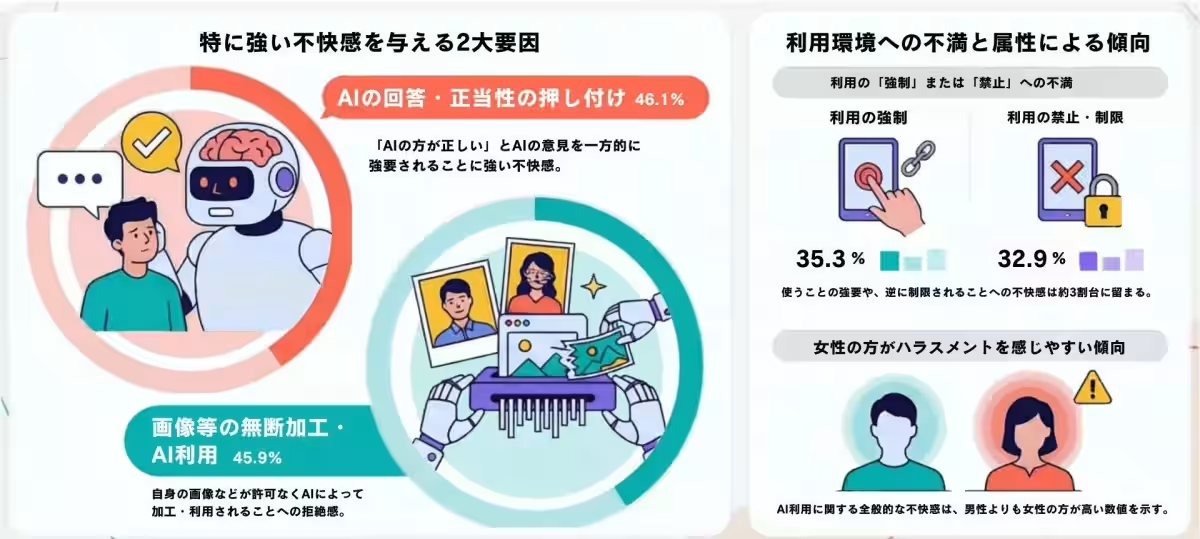
Harassment in the Age of AI
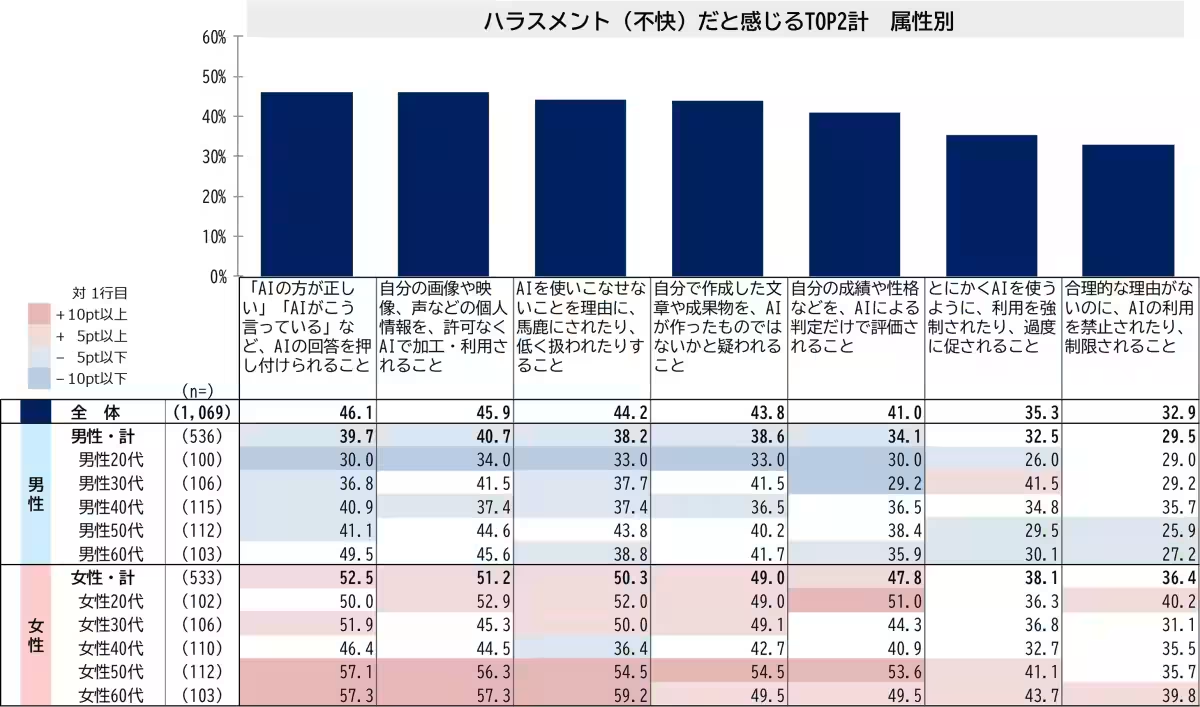
The growing use of AI in daily operations has also been scrutinized, with survey participants identifying discomfort stemming from AI applications. About 46.1% reported feeling uneasy when AI responses were imposed as the sole correct answer, and 45.9% were concerned about unauthorized use or manipulation of their images. More notably, responses indicated that women generally felt more harassed by AI practices compared to men.
The Shift in Awareness Around Harassment
While the overall recognition and experience of harassment have not necessarily seen dramatic changes when measured against previous inquiries, the survey suggests a burgeoning attention toward subtle harassment forms that might easily go unnoticed in everyday interactions. The shift towards a more aware and proactive approach to harassment indicates a vital evolution in workplace culture and social interactions.
Consumer Insights on Corporate Responsibility
As companies prepare to implement customer harassment policies, consumer sentiments highlight a duality of expectations. On one hand, consumers desire companies to take a firm stance against harassment to feel secure and respected in their interactions; on the other hand, they want to ensure that these policies do not impede their freedom to communicate effectively. Ensuring a balance will be crucial for businesses looking to maintain customer loyalty and a positive reputation.
Conclusion
In conclusion, the insights gleaned from the 2026 Harassment Survey illustrate a societal shift in how harassment is perceived and addressed in the workplace. With growing awareness around both direct and indirect forms of harassment, coupled with the complexities introduced by technology, companies will need to adopt a nuanced approach towards their policies. Balancing effective harassment measures with consumer concerns will be pivotal in developing and sustaining healthy workplace environments and fostering positive customer relations.
For further details on the survey results, including cross-tabulated data and a comprehensive report, please refer to the link for downloading the full report.
Download the survey results here
Topics People & Culture)

【About Using Articles】
You can freely use the title and article content by linking to the page where the article is posted.
※ Images cannot be used.
【About Links】
Links are free to use.