


Trends in Rental Properties Below 50 Tsubo for Small Businesses in Tokyo, Nagoya, and Osaka
Trends in Rental Properties Below 50 Tsubo for Small Businesses in Tokyo, Nagoya, and Osaka
A recent study conducted by Athome Lab, commissioned by Athome Co., Ltd., sheds light on the rental trends for properties below 50 tsubo in Tokyo, Nagoya, and Osaka for the second half of fiscal year 2025 (from October 2025 to March 2026). The analysis was drawn from data registered and disclosed on Athome’s real estate information network.
Tokyo Analysis
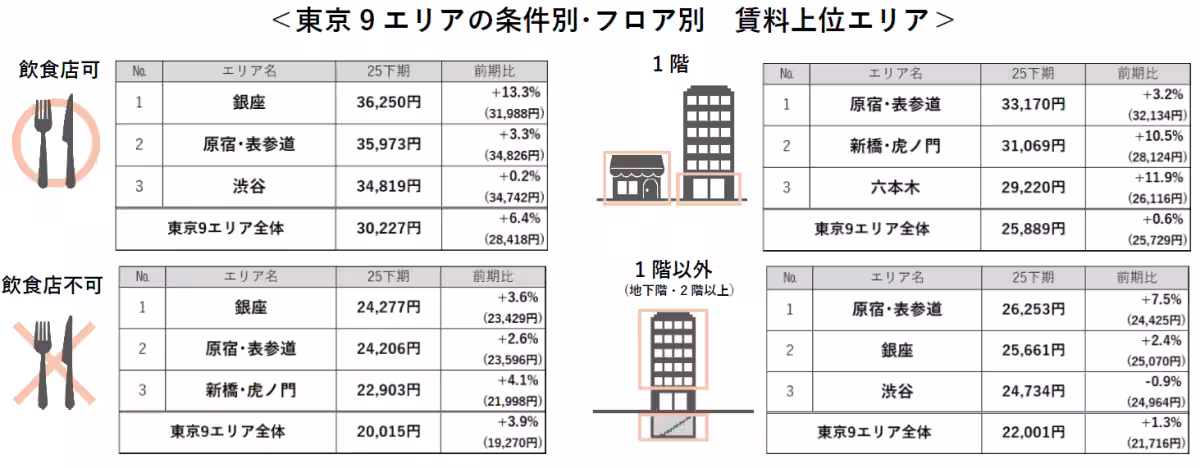
In Tokyo’s nine districts, the rental trends exhibit a significant variance based on property type:
- - For properties that allow restaurants: The average rent has reached ¥30,227 per tsubo, marking a 6.4% increase compared to the previous period.
- - For properties that do not allow restaurants: The average rent stands at ¥20,015 per tsubo, a 3.9% rise from last year. This illustrates a notable difference of ¥10,212 per tsubo or a 51.0% increase for restaurant-allowed properties over those that do not.
Floor Analysis
When classified by floor:
- - First-floor properties: Rent averages ¥25,889 per tsubo, with a modest increase of 0.6% from the previous period.
- - Other floors: The average rent is ¥22,001 per tsubo, reflecting a 1.3% increase. First-floor properties, therefore, exceed others by ¥3,888, or a 17.7% price margin.
Decrease in Available Properties
It's also noteworthy that the number of available properties has decreased for the seventh consecutive period, recording a decline of 1.6% from the previous term.
Nagoya and Osaka Highlights
Nagoya
- - In the vicinity of Nagoya Station, the rental prices for properties allowing restaurants have hit their highest mark since the first half of 2018.
Osaka
- - In the Namba and Shinsaibashi districts, all types of properties (based on both conditions and floor types) have consistently reported the highest rental rates since the first half of 2018, now for four consecutive periods.
Survey Overview
Target Areas
- - Tokyo: Ginza, Shimbashi, Roppongi, Shibuya, Harajuku, Ebisu, Shinjuku, Ikebukuro, Ueno.
- - Nagoya: Around Nagoya Station, Sakae.
- - Osaka: Umeda, Namba, Shinsaibashi.
Data Collection Method
- - The analysis covers rental properties ranging from 5 to 50 tsubo that have been registered on the real estate information network. All analyzed properties must be within a 10-minute walking distance from a station.
- - The reported rents include management fees and are based on the median of taxable prices per tsubo.
- - Only the most recent listings from the same building and floor are included when multiple listings exist.
- - Properties are categorized based on whether they allow restaurants and by floor level (first floor vs. others).
- - The first half of the year is defined as April through September, while the second half is October through March.
For more detailed statistics, you can download the PDF from the following link: Athome Market Data PDF
Topics Consumer Products & Retail)


【About Using Articles】
You can freely use the title and article content by linking to the page where the article is posted.
※ Images cannot be used.
【About Links】
Links are free to use.