Keywalker Supports Yokohama City in Building Heat Stroke Dashboard for Public Safety


Keywalker and Yokohama City Collaborate on Heat Stroke Dashboard
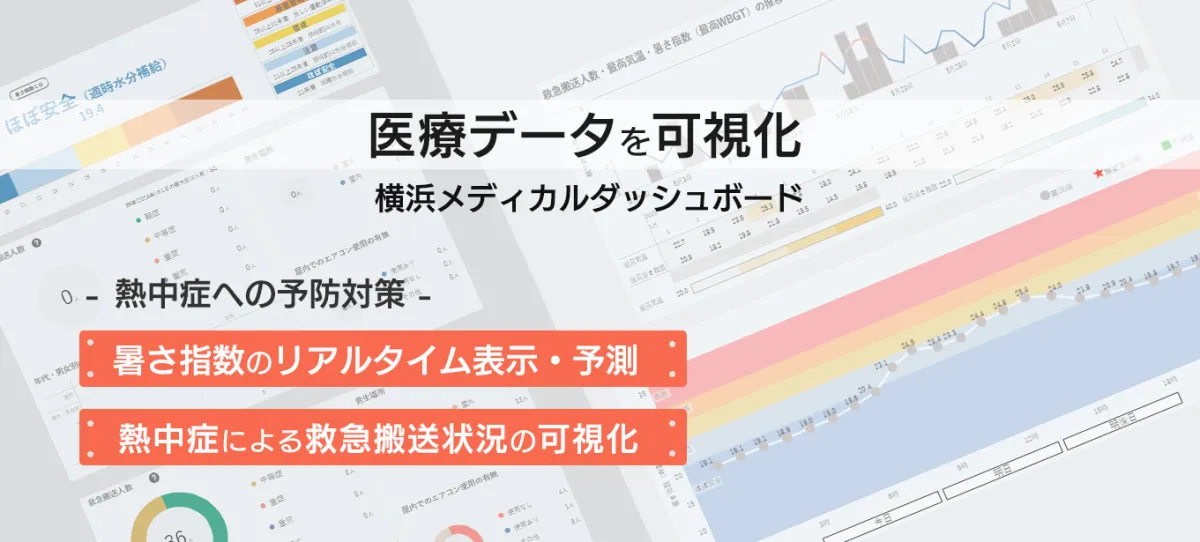
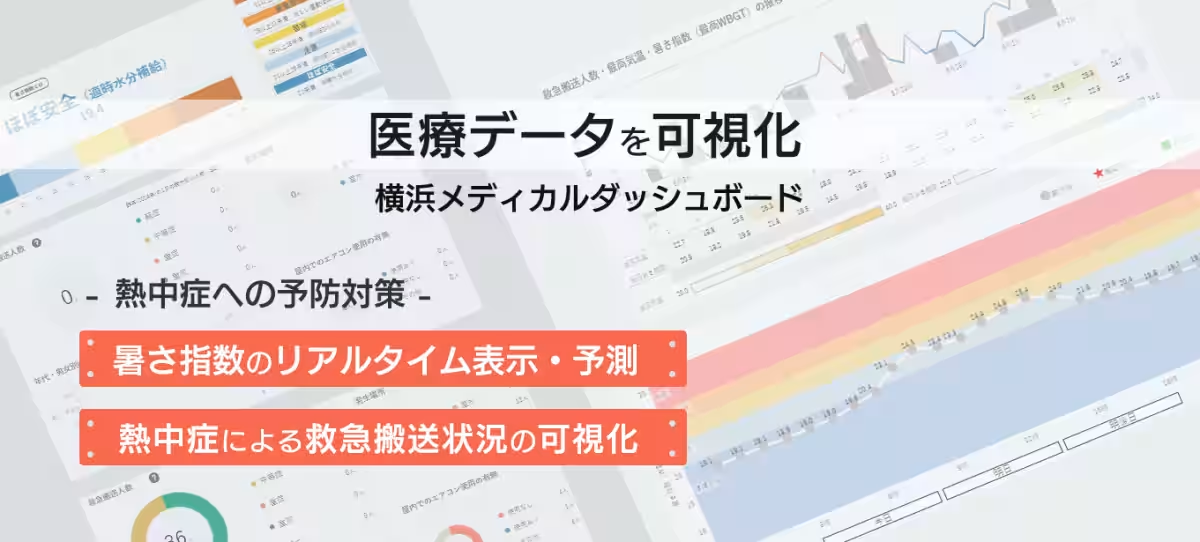
In a significant move towards public health safety, Keywalker Co., Ltd., based in Minato-ku, Tokyo, announced its collaboration with Yokohama City Medical Bureau in the development of the "Heat Stroke Dashboard". This innovative initiative aims to provide real-time data visualization of heat-related information, including the Wet Bulb Globe Temperature (WBGT) index, thereby assisting citizens in taking appropriate measures against heat stroke.
Overview of the Heat Stroke Dashboard
Building upon previous successful projects, such as the Infectious Disease Dashboard that visualizes data for 15 specific diseases using Tableau's data visualization technology, Keywalker has extended its expertise to create the Heat Stroke Dashboard. This new interface targets the visualization of predicted temperatures, risk levels for heat stroke, and emergency transport situations due to heat-related illnesses.
The objective is to develop a user-friendly interface that serves as a vital information resource for Yokohama's residents in preventing heat-related health issues. The dashboard is anticipated to play a crucial role in enhancing the awareness of heat stroke risks and encouraging preventive actions among the populace. You can learn more about this initiative on the Yokohama City Medical Bureau press release page: Yokohama City Press Release.
The Heat Stroke Dashboard can be accessed directly via this link: Heat Stroke Dashboard.
Impact of the Heat Stroke Dashboard
Enhanced Safety Awareness
The visualized data available through the Heat Stroke Dashboard has a significant impact on raising public awareness regarding heat stroke risks. By presenting this information in an easily understandable format, citizens are more likely to recognize when they need to take preventive measures based on current heat conditions.
Data-Driven Decision Making
Moreover, the dashboard's design allows for the accumulation and analysis of historical data. This capacity enables the understanding of annual trends and helps predict future preventive measures, thereby serving as a valuable resource for decision-makers. As Keywalker continues to strengthen its collaborations with public institutions and local governments, it actively contributes to solving societal challenges through data-driven solutions.
About Keywalker Co., Ltd.
Keywalker provides an array of services to various enterprises and research institutions, ranging from data collection via websites to the integration, analysis, and visualization of data within organizations. By transforming collected data into visual formats, Keywalker aids organizations in discovering new insights and seeking effective actions that can enhance productivity, reduce costs, and expedite management decisions.
The company offers a one-stop solution for data collection and visualization, empowering clients to build data-driven organizational structures that align with modern demands.
Tableau Solutions
Explore Keywalker's Tableau solutions for beautifully visualizing and analyzing big data: Tableau Solutions. Additionally, check out their dashboard gallery to see examples of their work: Dashboard Gallery.
Company Information
- - Name: Keywalker Co., Ltd.
- - Location: 4F REVZO Toranomon, 1-8-1 Nishishinbashi, Minato-ku, Tokyo
- - CEO: Kazuto Kobayashi
- - Established: November 22, 2000
- - Service Focus: Collection, organization, accumulation, visualization, and analysis of big data, along with AI solutions.
- - Website: Keywalker
Topics Health)

【About Using Articles】
You can freely use the title and article content by linking to the page where the article is posted.
※ Images cannot be used.
【About Links】
Links are free to use.