Unveiling the JTB Regional Power Index 2025: Insights for Local Revitalization


JTB Regional Power Index 2025
Introduction
In an effort to promote local revitalization, JTB Corporation has unveiled its updated Regional Power Index for 2025. This comprehensive index analyzes the perceptions and satisfaction levels of visitors across 240 regions in Japan. This thorough research, conducted by JTB's Institute of Comprehensive Research, sheds light on various aspects of each region's attractiveness and challenges, providing invaluable insights that go beyond mere municipal data.
Features and Strengths of the JTB Regional Power Index
The JTB Regional Power Index offers several key features that distinguish it as a crucial tool for local governments and stakeholders:
1. Awareness and Satisfaction Metrics: The index highlights awareness levels, visitation rates, imagery, and overall satisfaction of visitors.
2. Relative Evaluation: It allows for comparative analysis against competing regions, presenting a benchmark for performance.
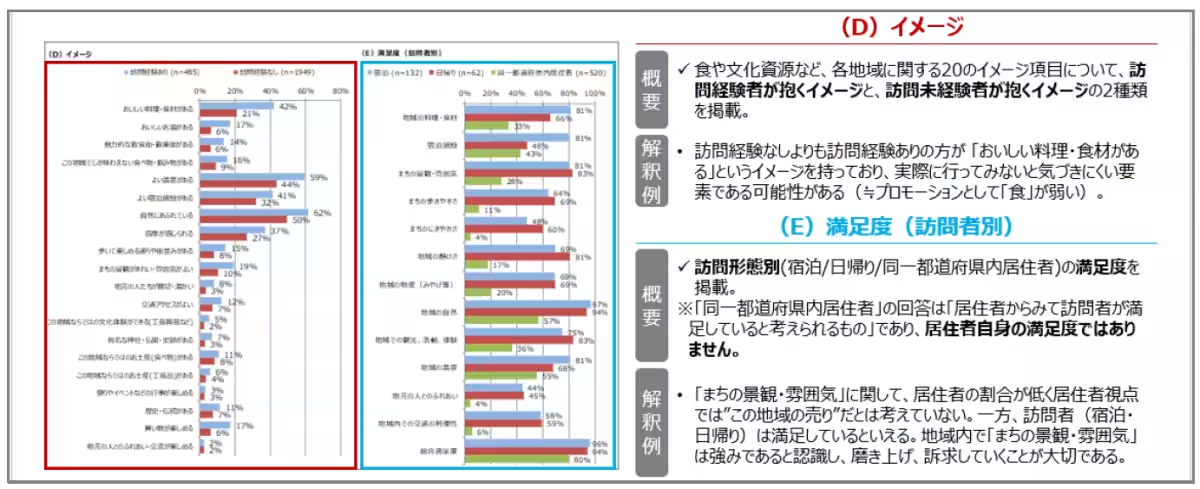
3. Understanding the Gap: The index identifies the disparity between residents' perceptions and those of visitors, crucial for strategic improvements.
4. Impact Analysis: It analyzes factors influencing the intent to visit, which aids in spotlighting regional strengths and areas requiring enhancement.
Insights from the Index
The JTB Regional Power Index delves into various dimensions, including:
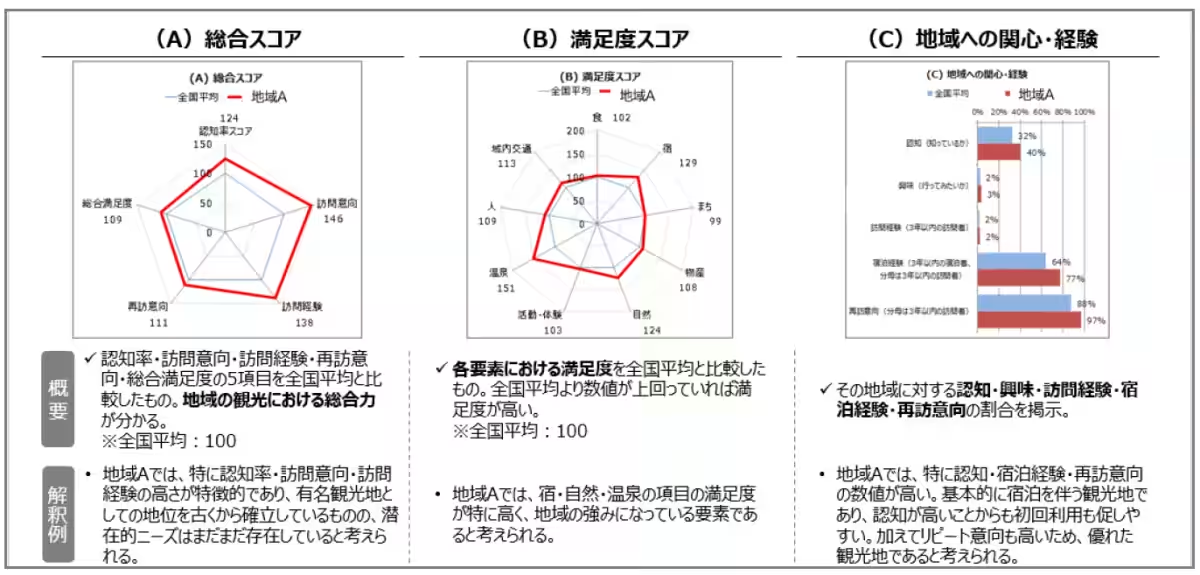
1. Overall Satisfaction Scores: It ranks regions based on comprehensive and satisfaction indexes, allowing for direct comparisons.
2. Visitor Demographics: The index explores differences based on visitor demographics and elucidates gaps in perception between residents and visitors.
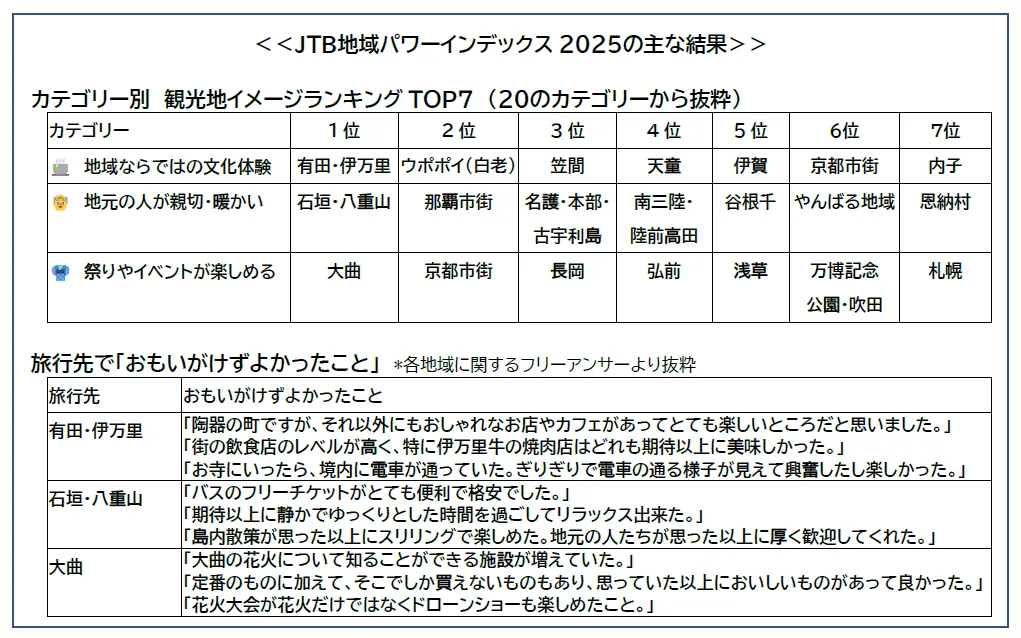
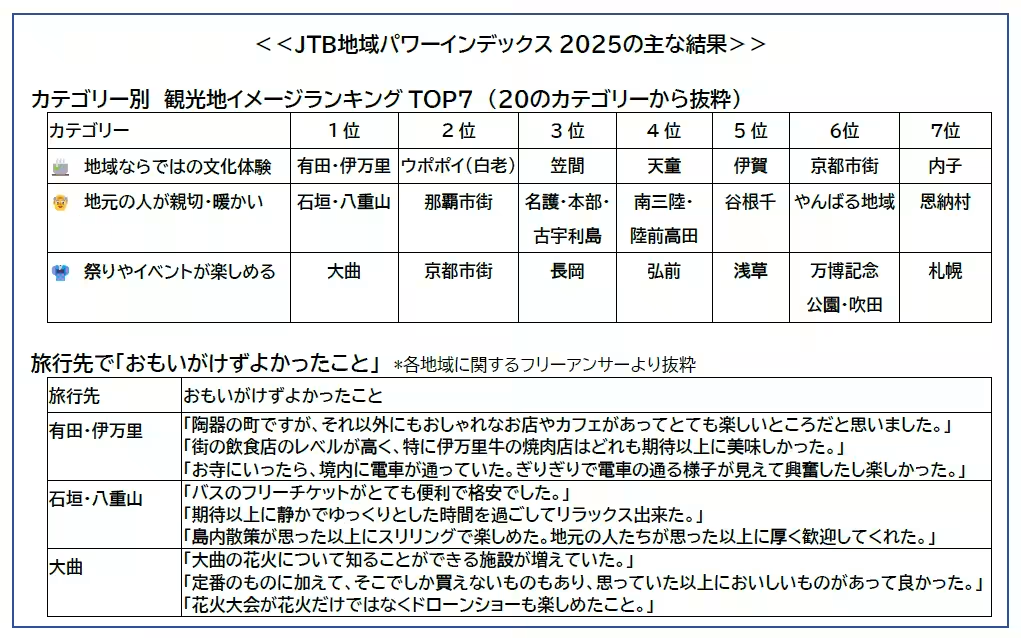
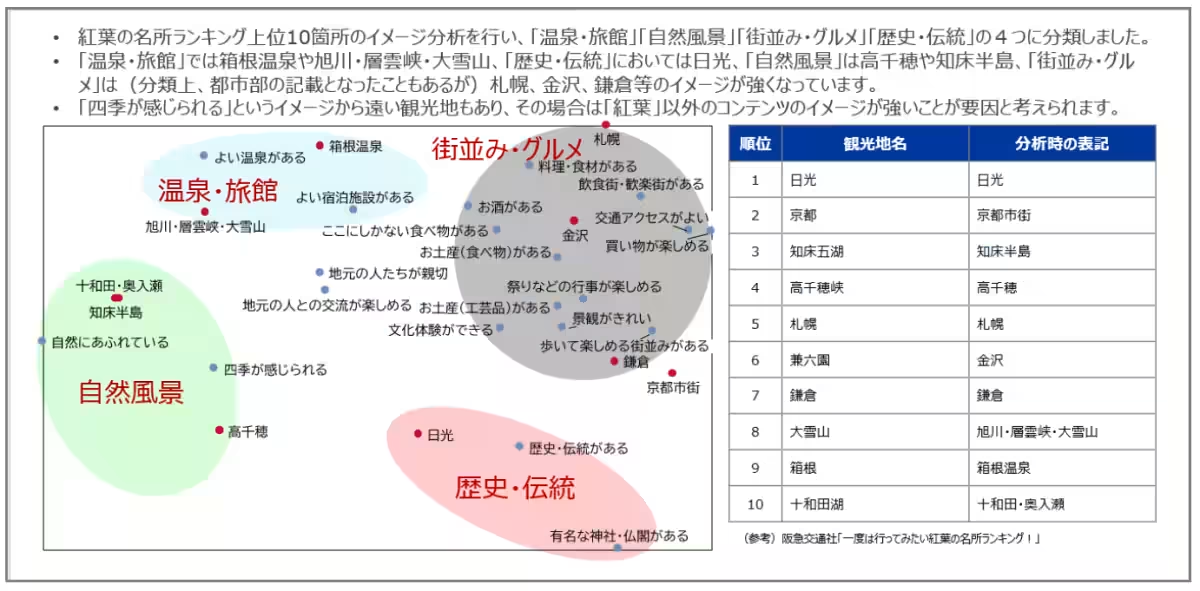
3. Comparative Imagery Analysis: The index examines visitor imagery, such as the perception of autumn foliage spots, comparing perceptions across different regions.
Overview of the 2025 Research
Methodology
The survey was conducted via an online questionnaire, targeting a demographic of males and females aged 15 to 79 across Japan.
Sample Size and Period
1. Resident and Visitor Surveys: 47,863 samples were collected during February to April 2025
- This involved 47 prefectures, categorized by gender and age (10 segments), collecting responses from 50 samples each.
2. Visitor Surveys: 38,780 samples were obtained between March and April 2025, exclusively from individuals who had visited one of the 240 regions within the last three years.
Key Survey Items
The research evaluated several important factors, including:
- - Overall satisfaction and awareness
- - Visitor experiences, including accommodation and intent to revisit
- - Primary reasons for visiting and anticipated attractions
- - Element-specific satisfaction, covering local cuisine, lodging, onsen experiences, etc.
- - General regional imagery and surprises encountered by visitors
- - Recommendations from residents to incoming visitors
Conclusion
The JTB Regional Power Index is not just a statistical report; it is a strategic tool designed to assist local stakeholders in understanding their regions better. While data from the index is not available for public distribution, businesses and organizations interested in utilizing the index for reports or consulting services can reach out for inquiries.
For further queries:
- - Consultation for Reports and Strategic Use: Contact JTB's Institute for Comprehensive Research at [email protected]
- - Media Inquiries: Reach JTB’s PR Department in Tokyo at 03-5796-5833 or in Osaka at 06-6260-5108.
Through these efforts, JTB aims to empower local regions, enabling them to harness their unique strengths for sustainable tourism growth.
Topics Consumer Products & Retail)


【About Using Articles】
You can freely use the title and article content by linking to the page where the article is posted.
※ Images cannot be used.
【About Links】
Links are free to use.