


TikTok Shop 2026 January Report: Trends in Japan's E-commerce Market
Overview of TikTok Shop in Japan
The TikTok Shop in Japan has shown remarkable fluctuations since its launch, and the latest reports reveal significant trends that brands and creators should note. In January 2026, the market operated under the auspices of Live Commerce Inc., which uses the FastMoss analytical tool developed by Beijing Youlian Technologies to track dynamics in the e-commerce sector. This report aims to dissect sales figures, trends, and consumer behavior based on the most recent data available.
Sales Metrics for January
According to the FastMoss market data, there has been a slight variation in sales figures for January compared to December. Here’s a comparative analysis:
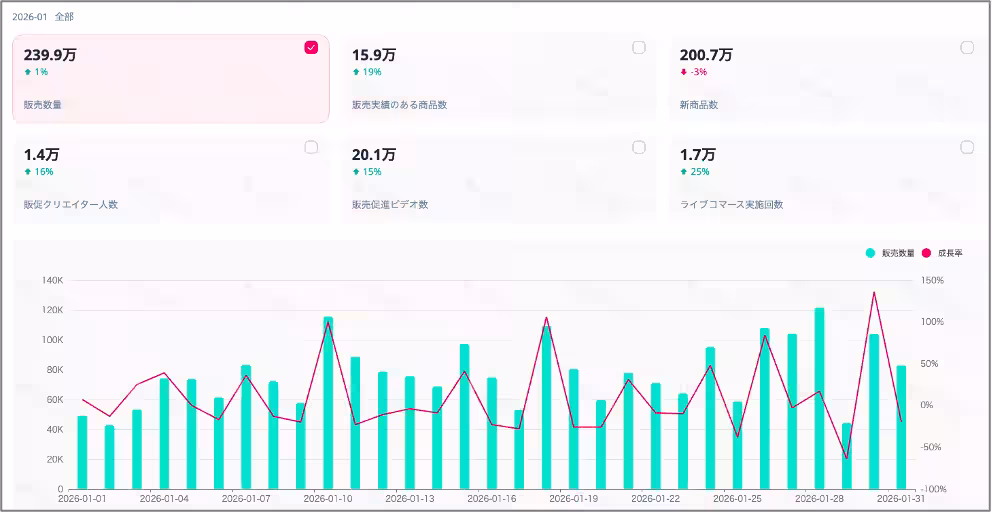
| Metric | January | December | Change | Growth Rate |
|---|---|---|---|---|
| ----- | -- | --- | ---- | --- |
| Sales Volume | 2,399,000 | 2,383,000 | +16,000 | +0.7% |
| Active Product Count | 159,000 | 133,000 | +26,000 | +19.5% |
| New Product Count | 2,007,000 | 2,065,000 | -58,000 | -2.8% |
| Average Selling Price | ¥2,334 | ¥2,528 | +¥4.7 | +0.19% |
| Sales via Videos | 201,000 | 760,000 | -559,000 | -73.5% |
| Live Commerce Events | 17,000 | 20,000 | -3,000 | -15.0% |
The January gross merchandise value (GMV) for TikTok Shop was approximated at ¥5.6 billion, marking a notable decline compared to approximately ¥6.02 billion in December. The year-on-year growth took a downturn, primarily attributed to fewer promotional events and a seasonal drop in consumer spending during the New Year period, alongside a significant decrease in live broadcasts.
Product Pricing Trends
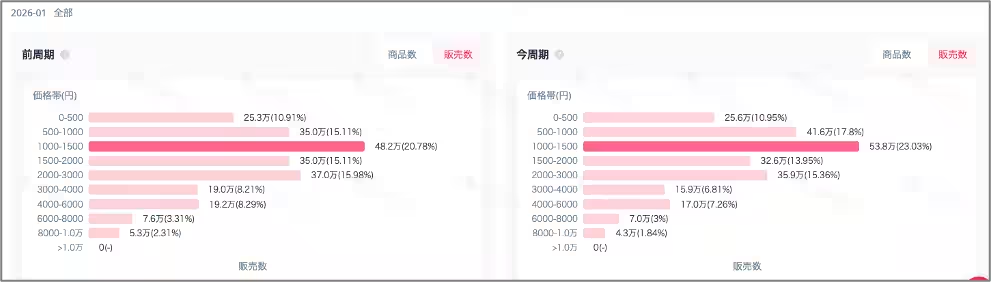
The distribution of price ranges for products sold in January has shown an intriguing trend:
| Price Range | January (%) | December (%) |
|---|---|---|
| ------ | --- | ----- |
| ¥1,000 - ¥1,500 | 23.03 | 20.78 |
| ¥500 - ¥1,000 | 17.80 | 15.98 |
| ¥2,000 - ¥3,000 | 15.36 | 15.11 |
Categories such as Beauty & Personal Care saw a robust growth of 8.4%, indicating a sustained consumer preference in these essential sectors. In contrast, categories heavily promoted during year-end sales, such as Food & Drinks, and Ladies’ Fashion, experienced significant downturns of -10.4% and -17.6%, respectively.
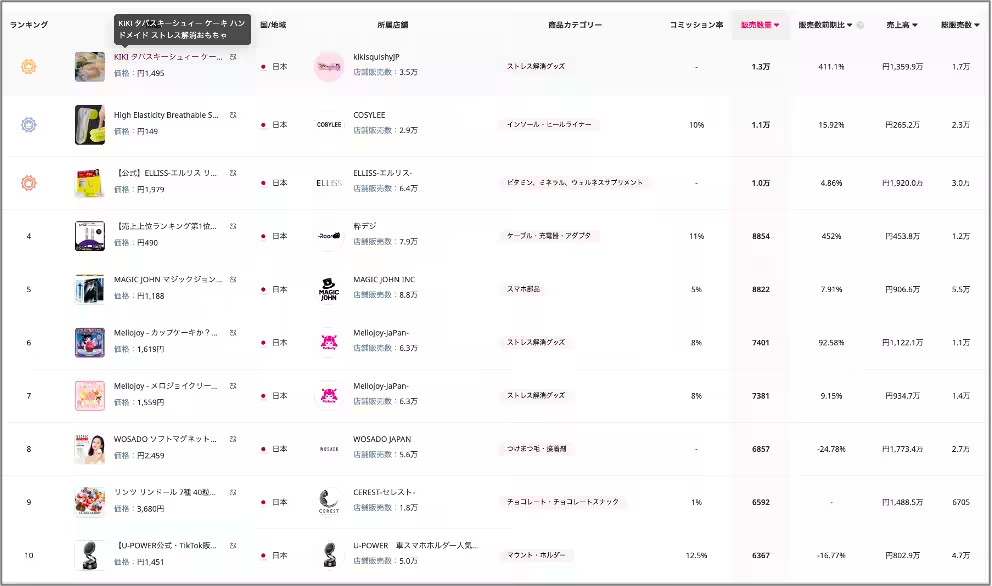
Top Product Categories and Growth
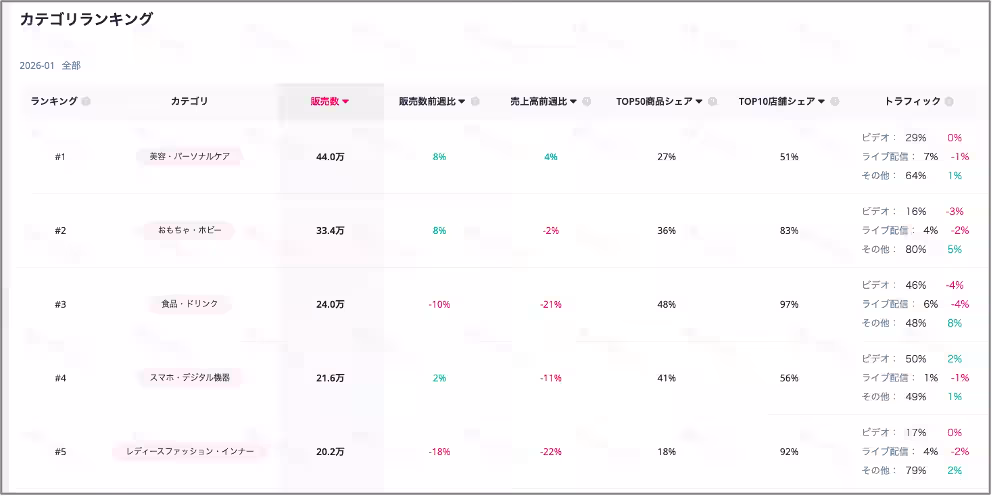
During January, the distribution for product sales showcased these top five categories:
| Category | January Sales | December Sales | Change | Growth (%) |
|---|---|---|---|---|
| ------- | --- | ---- | -- | ---- |
| Beauty & Personal Care | 440,000 | 406,000 | +34,000 | +8.4 |
| Toys & Hobbies | 334,000 | 310,000 | +24,000 | +7.7 |
| Food & Drinks | 240,000 | 268,000 | -28,000 | -10.4 |
| Smartphones & Digital Devices | 216,000 | 245,000 | -29,000 | +1.9 |
| Ladies’ Fashion | 202,000 | 212,000 | -10,000 | -17.6 |
The stability observed in the sales of low-to-mid-tier consumer essentials reflects a shift in consumer behavior toward practicality over luxury, confirming the sustained dominance of video-driven purchasing trends and a growing reliance on short-form video showcases on TikTok.
Sales Channel Insights
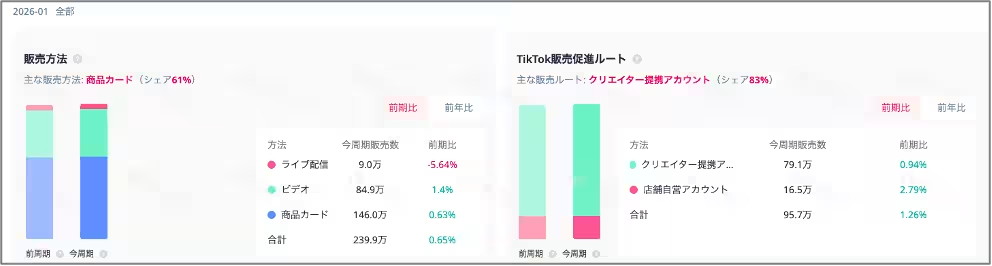
Analyzing how sales are generated reveals:
| Sales Channel | January Sales | December Sales | Change (%) |
|---|---|---|---|
| ------ | --- | ---- | -- |
| Live Commerce | 90,000 | 95,000 | -5.3 |
| Video Sales | 849,000 | 837,000 | +1.4 |
| Product Cards | 1,460,000 | 1,450,000 | +0.7 |
Sales through live events saw a decline, while video and product card channels demonstrated resilience, indicating a gradual shift towards stability in the sales influx channels. In terms of account types, both creator-linked accounts and self-operated store accounts also exhibited slight growths, emphasizing a trend towards diversifying sales channels.
Conclusion
In conclusion, January's performance emphasizes how the TikTok Shop embraces stability through essential goods, accompanied by strong growth in Beauty & Personal Care while dealing with post-holiday adjustments across other categories. The evolution of consumer behavior indicates an adaptive market that prioritizes everyday utility over luxury consumerism, paving the way for a more predictable sales future in Japan’s TikTok e-commerce landscape.
For more detailed insights, tools like FastMoss can provide significant advantages for businesses aiming to navigate this dynamic market effectively.


Topics Consumer Products & Retail)


【About Using Articles】
You can freely use the title and article content by linking to the page where the article is posted.
※ Images cannot be used.
【About Links】
Links are free to use.