Survey Reveals Preferences of Cryptocurrency Chart Users Based in Japan


Insights from Cocomoora's Cryptocurrency Chart Survey
In a bid to understand user preferences and experiences regarding cryptocurrency charts, Cocomoora conducted a comprehensive survey among cryptocurrency users in Japan. Here, we delve into the key findings of this survey, which aimed to capture the voices of those actively engaging with various cryptocurrency platforms.
Survey Overview
The survey was carried out online between September 10 and September 23, 2025, targeting individuals aged 20 and over who have experience in cryptocurrency usage. A total of 181 valid responses were collected, with 132 from men and 49 from women.
Key Findings
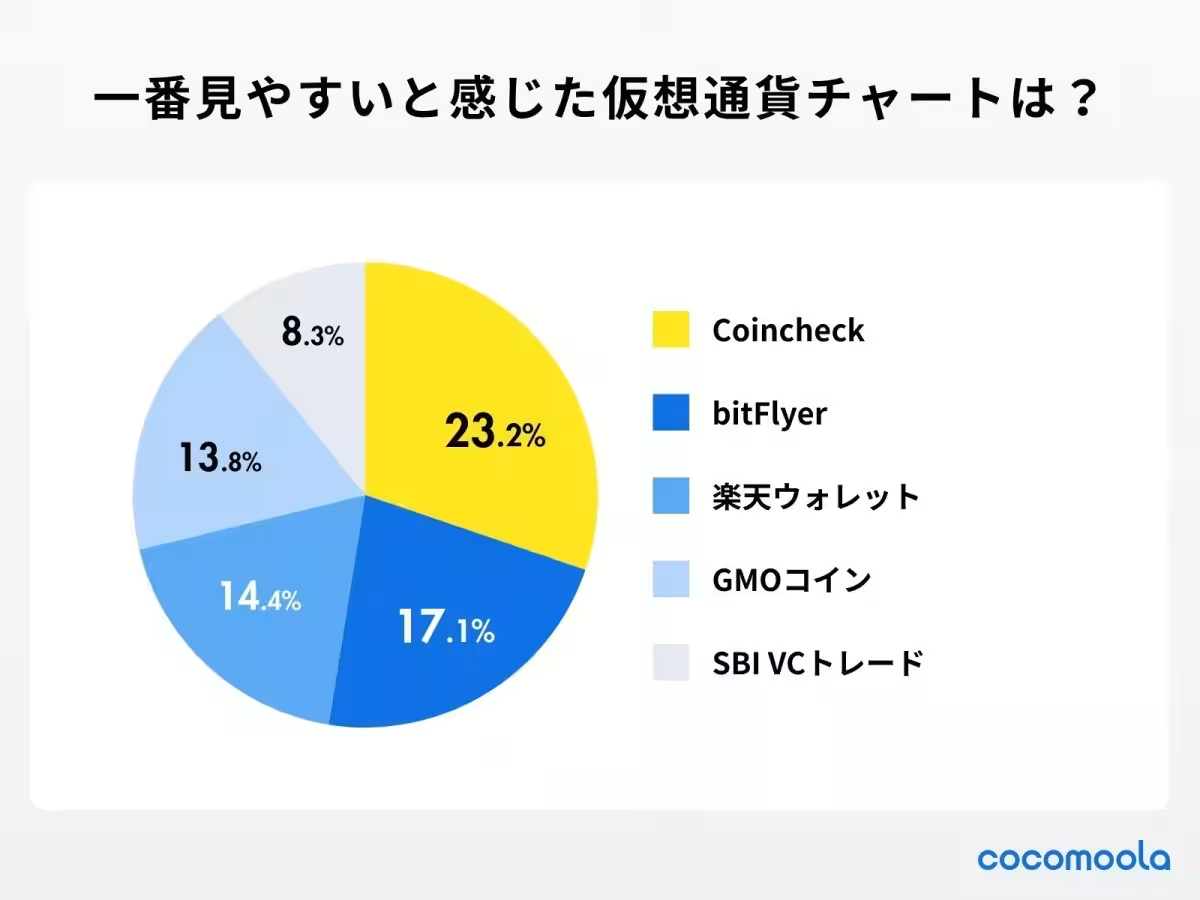
1. Most Preferred Cryptocurrency Charts:
According to the responses, the chart from Coincheck was deemed the most user-friendly, garnering a vote share of 23.2%. The chart from bitFlyer followed closely with 17.1%, and Rakuten Wallet was chosen by 14.4% of respondents. Factors such as visibility and design quality heavily influenced these choices.
2. Utilized Time Frames:
The most common time frame for analyzing cryptocurrency charts was the daily view, chosen by 24.9% of participants. This was followed by the 5-minute view at 23.8%, and the 15-minute view at 22.7%. Such preferences indicate a strong inclination toward short-term trading over long-term perspectives.
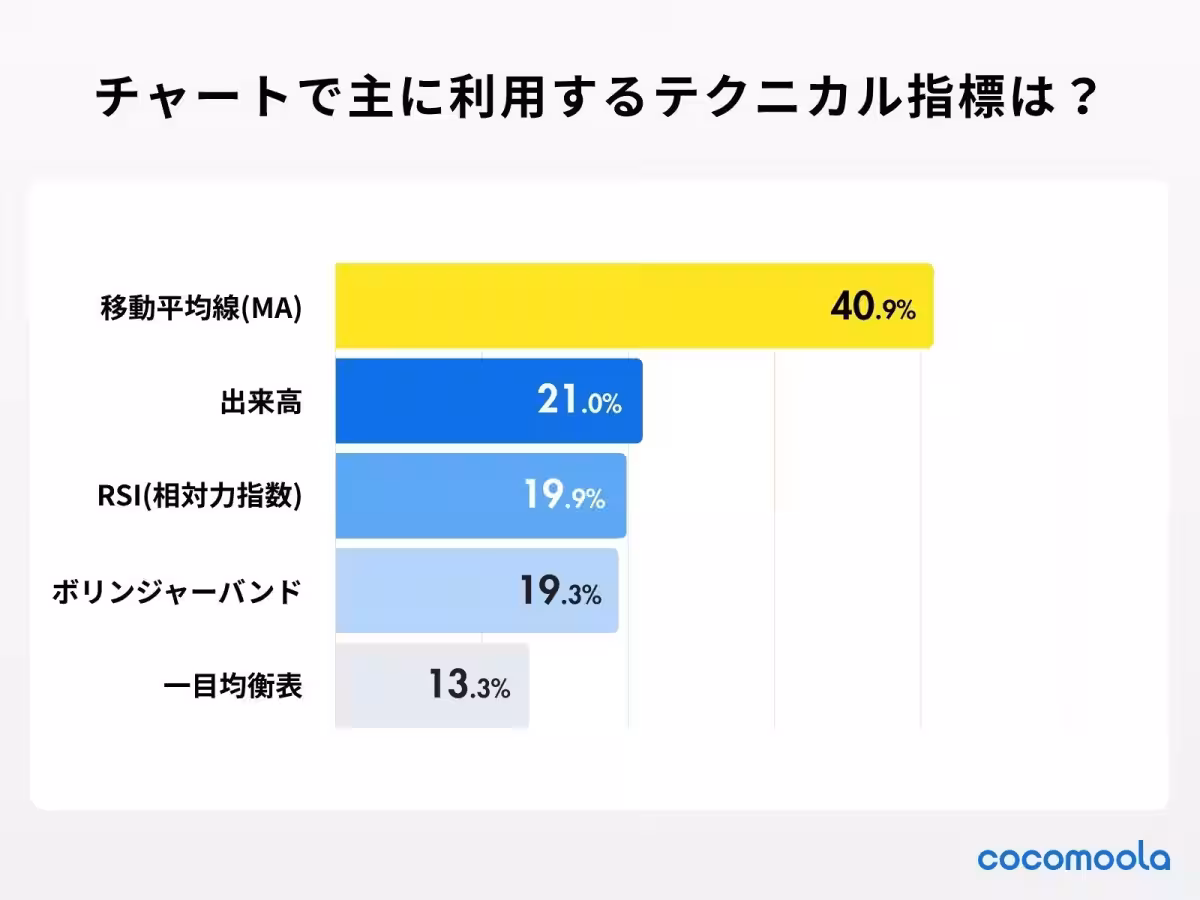
3. Technical Indicators in Use:
The Moving Average (MA) stood out as the preferred technical indicator, utilized by 40.9% of users. Other popular choices included Volume at 21.0%, and Relative Strength Index (RSI) at 19.9%. This trend reflects a significant reliance on established indicators for informed trading decisions.
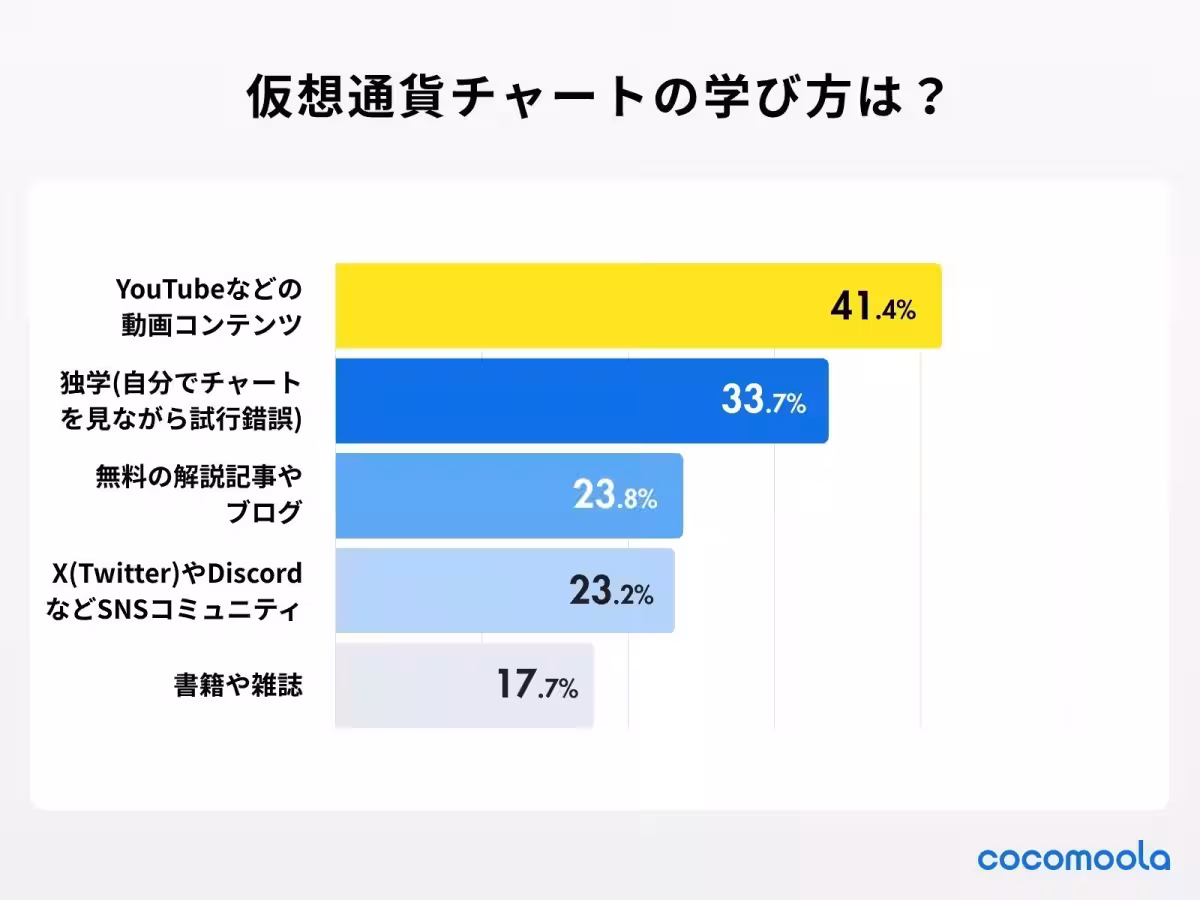
4. Learning Methods for Chart Reading:
An overwhelming 41.4% of users reported learning how to read cryptocurrency charts through video content, particularly on platforms like YouTube. Self-study methods were also popular, indicated by 33.7% of respondents who preferred trial and error approaches. Free articles and blogs were a learning source for 23.8%.
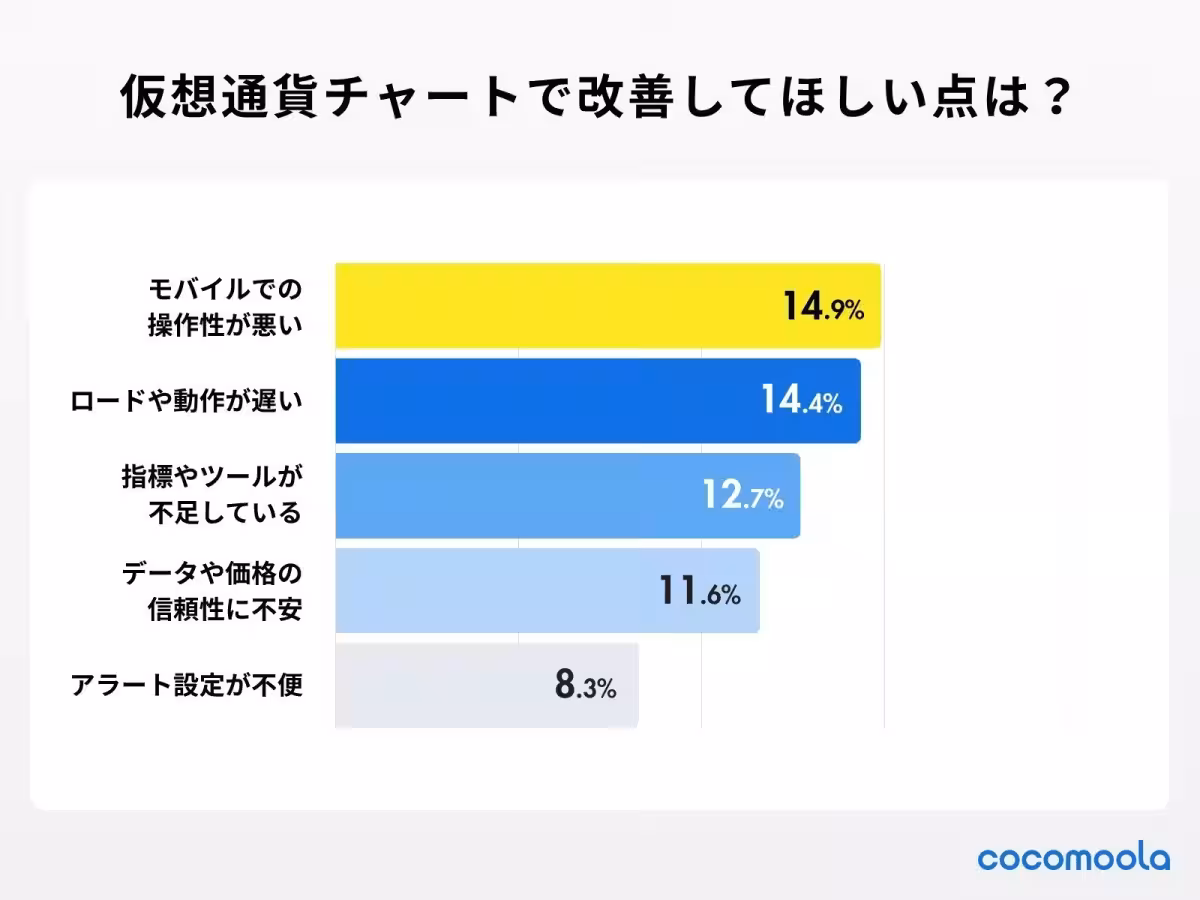
5. Areas for Improvement:
Respondents identified key areas that require enhancement within cryptocurrency charting tools. Notably, 14.9% expressed concerns over mobile usability, while 14.4% cited slow loading times as a major drawback. These insights suggest that user interface and experience require urgent attention.
Conclusion
Cocomoora's insightful survey provides a window into the preferences of cryptocurrency users in Japan, showcasing a clear demand for visually appealing and functional charting tools. As the digital asset landscape continues to evolve, chart providers must address the highlighted shortcomings to enhance user satisfaction and engagement.
About Cocomoora
Cocomoora derives its name from the concept of being a comprehensive source of information on various everyday items. The platform strives to enable users to make the best choices by offering detailed comparisons and recommendations across diverse topics.
Zero Accel Corporation
Founded in April 2020 and headquartered in Chiyoda, Tokyo, Zero Accel operates the Cocomoora platform, reinforcing its commitment to aiding users in their decision-making processes regarding digital assets.


Topics Consumer Products & Retail)


【About Using Articles】
You can freely use the title and article content by linking to the page where the article is posted.
※ Images cannot be used.
【About Links】
Links are free to use.