



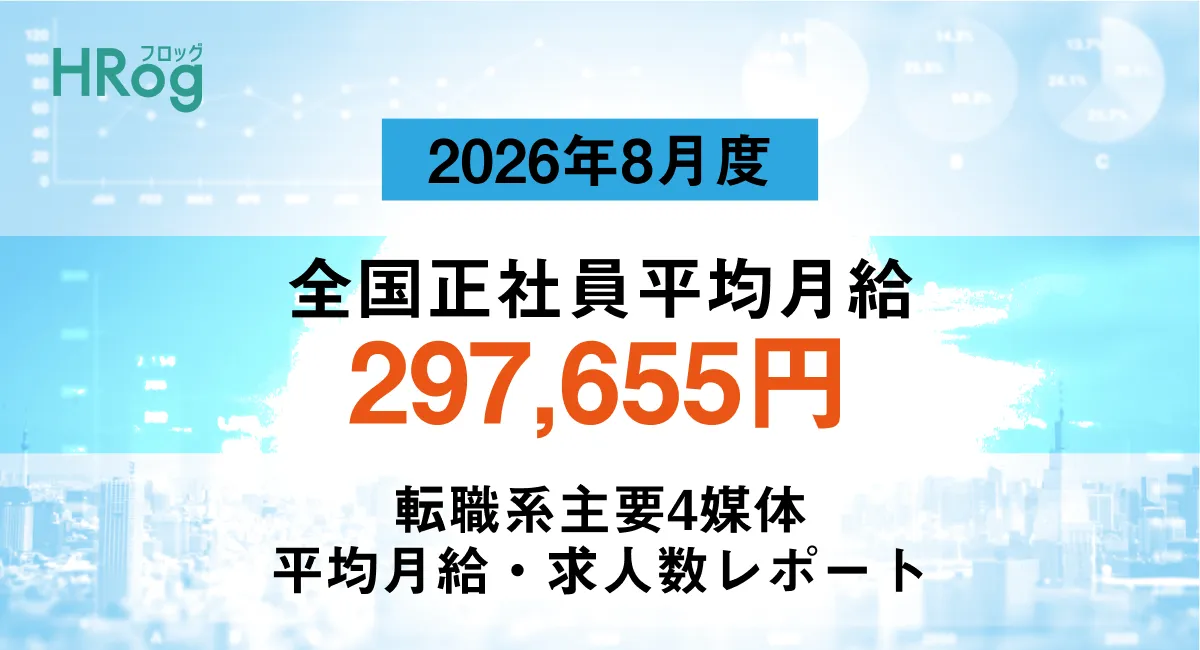
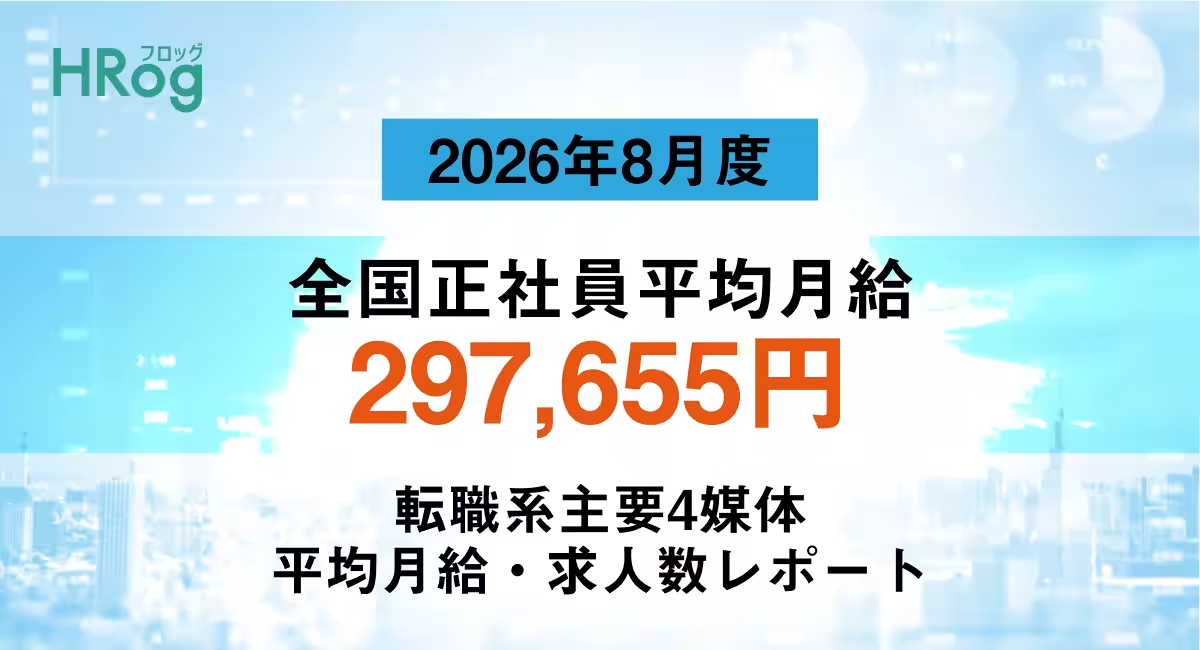
Average Monthly Salary for Full-time Employees in Japan Stands at 297,655 Yen as of August 2026
Overview of Average Salary Data in Japan
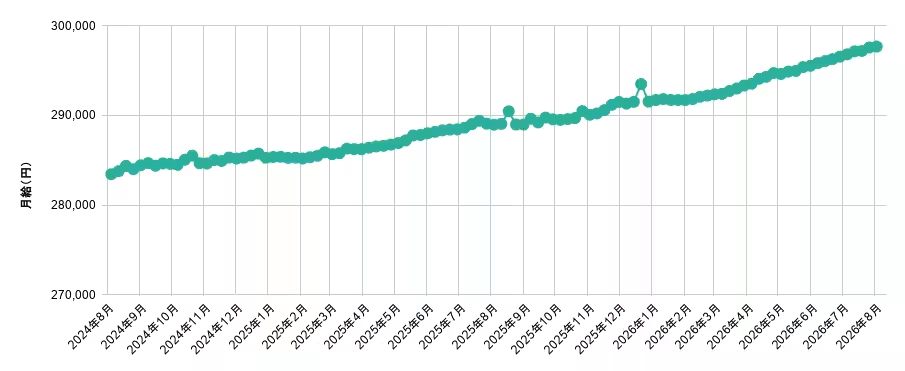
In a recent report by Frog Corporation, based in Chiyoda, Tokyo, the average monthly salary for full-time employees in Japan reached 297,655 yen for August 2026. This marks a 0.29% increase from the previous month and a significant 3.01% increase compared to the same period last year. The report analyzed job postings across major platforms including 'Mynavi Career', 'En Ten Shoku', 'Doda', and 'Type', leveraging their big data analysis tool, HROG Chart.
Salary Trend Analysis
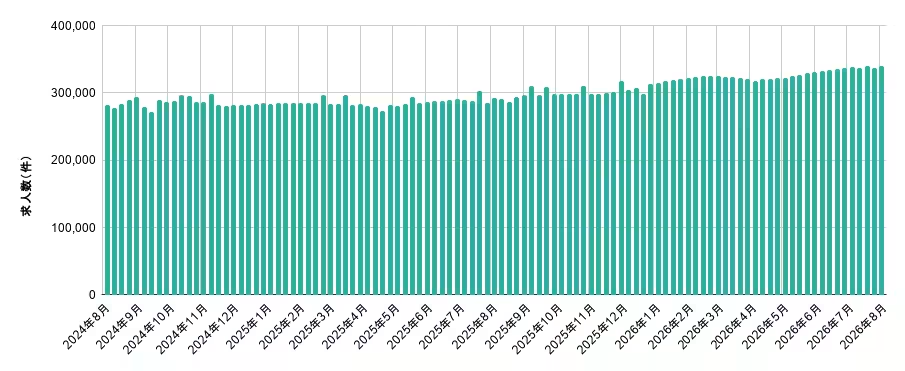
According to the findings, the total number of full-time job postings stood at 339,748, reflecting an uptick of 1,092 postings month-over-month and 47,480 year-over-year. The detailed salary trend shows continuous growth, providing positive insight into the economic landscape for job seekers and employers alike.
Monthly Changes in Average Salary
The figures highlighted in the report indicate not just a marginal increase but a consistent upward trend over the last 25 months. [Figure 1] showcases these statistics, illustrating both the monthly fluctuations and the year-over-year growth in average salaries across Japan.
Job Type Salary Rankings
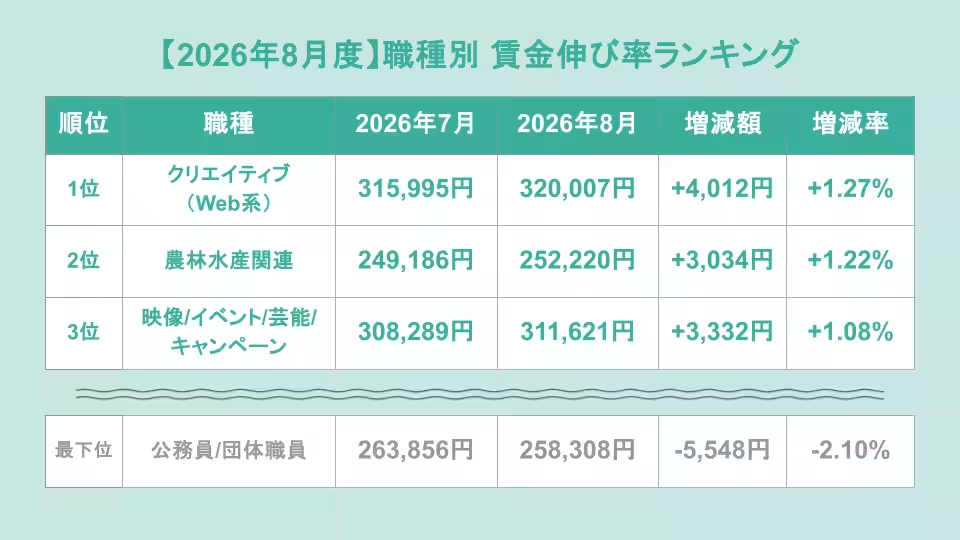
The report goes beyond averages to provide insights into various job categories. Notably, the top three professions with the highest salary growth compared to the previous month include:
1. Creative (Web): +4,012 yen, an increase rate of +1.27%
2. Agriculture, Forestry, and Fisheries: +3,034 yen, increase rate at +1.22%
3. Film, Events, Entertainment, and Campaigns: +3,332 yen, +1.08%
Conversely, the lowest-ranked profession was Public Servants and Organization Employees, showing a decrease of -5,548 yen (-2.10%). [Figure 3] presents a visual representation of these contrasting salary changes.
Job Postings by Type
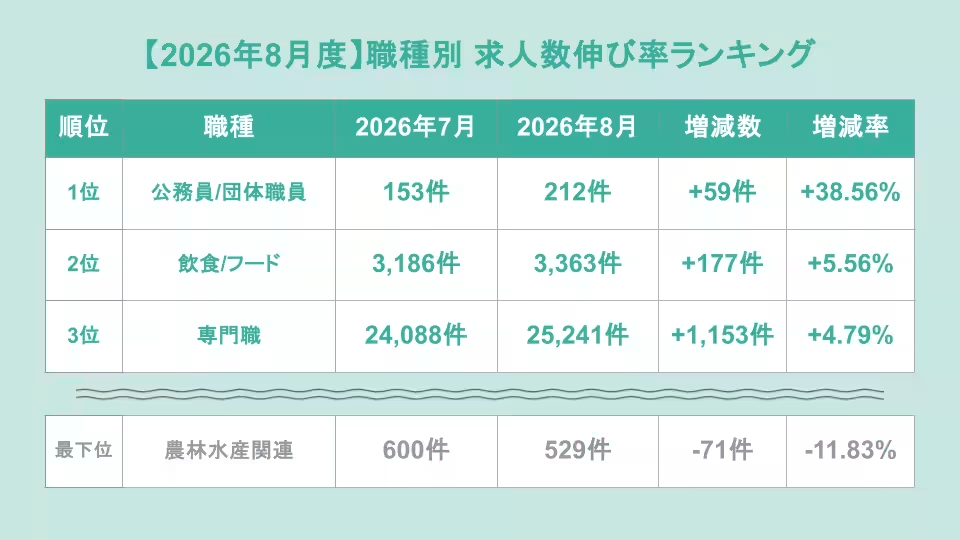
In terms of job postings, the ranking changes significantly. The top three categories for job posting increases are:
1. Public Servants / Organization Employees: +59 listings (+38.56%)
2. Food and Beverage: +177 listings (+5.56%)
3. Specialized Professions: +1,153 listings (+4.79%)
Meanwhile, the sector with the least increase was again in Agriculture with a decline of -71 postings (-11.83%). [Figure 4] elaborates on the trend in job type increases.
Regional Salary Insights
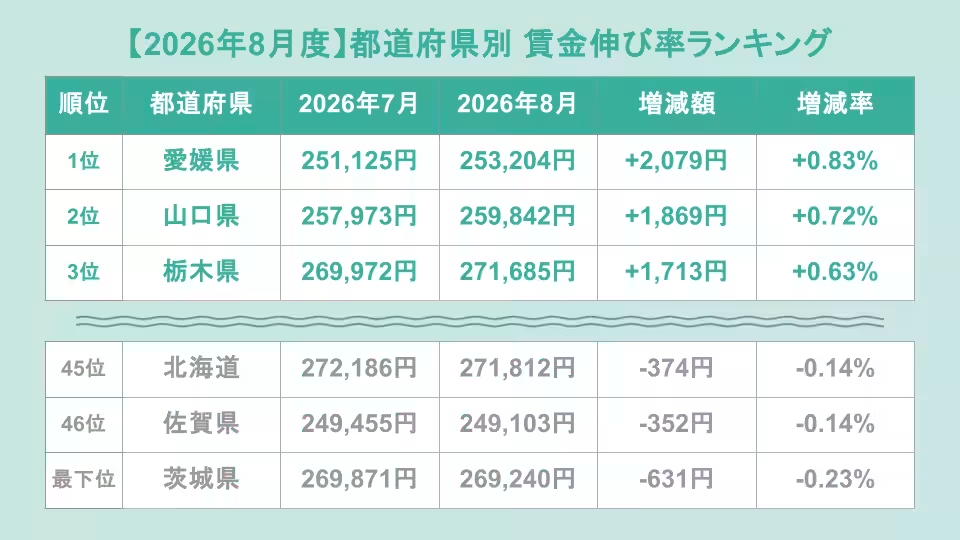
Analyzing the salary trends by region reveals additional variations. The top three prefectures with the highest salary growth compared to last month are:
1. Ehime: +2,079 yen (+0.83%)
2. Yamaguchi: +1,869 yen (+0.72%)
3. Tochigi: +1,713 yen (+0.63%)
In contrast, the lowest performers include Hokkaido with -374 yen, Saga with -352 yen, and Ibaraki, which fell by -631 yen. [Figure 5] provides more detail on these areas.
Regional Job Posting Changes
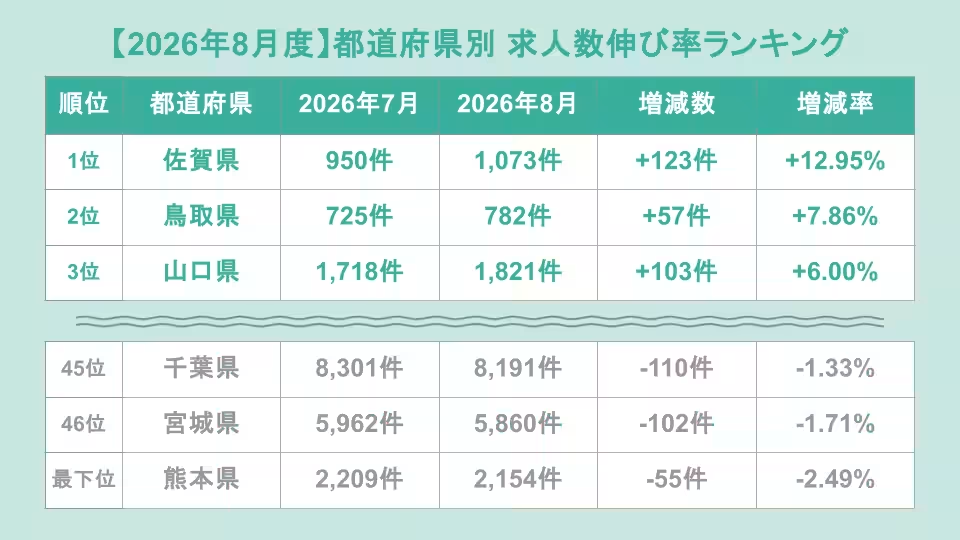
Regionally, job postings showed varied growth as well. Leading the growth were:
1. Saga: +123 postings (+12.95%)
2. Tottori: +57 postings (+7.86%)
3. Yamaguchi: +103 postings (+6.00%)
However, regions struggling include Chiba with a decrease of -110 postings and Miyagi decreasing by -102 postings, while Kumamoto saw a decline of -55, making it the lowest. [Figure 6] visualizes these trends.
Conclusion and Data Access
The report not only explores salaries and job postings but also offers a comprehensive overview of the job market landscape in Japan. For those interested in gaining access to the complete data set or a thorough analysis, please visit the HRog Contact Page and specify the report name you are interested in.
About HRog Chart
Frog Corporation's HRog Chart offers a unique insight into job market analytics, allowing users to easily navigate and analyze data from approximately 150 job platforms with just a few clicks. This tool is invaluable for understanding hiring trends, salary benchmarks, and market dynamics.
For further inquiries regarding HRog Chart, contact our sales department at [email protected] or call us at 03-5296-9595.
Topics Business Technology)
【About Using Articles】
You can freely use the title and article content by linking to the page where the article is posted.
※ Images cannot be used.
【About Links】
Links are free to use.