


Exploring Differences in Survey Response Patterns: Paper vs. Tablet
Exploring Differences in Survey Response Patterns: Paper vs. Tablet
Japan Information Inc., based in Chuo-ku, Tokyo, has recently carried out a crucial study aimed at understanding how response tendencies differ between traditional paper surveys and modern tablet-based surveys. This evaluation specifically focused on a form of research known as Central Location Testing (CLT), where participants gather to engage in product sampling, tasting, and design evaluation.
Background and Purpose of the Study
In our CLT surveys, participants can choose between two modes of response:
1. Paper Response: Using printed questionnaires and pen to self-record answers.
2. Tablet Response: Responding via a web-based interface on a tablet device.
A decade ago, the paper response method was primarily used. However, we have seen an increasing trend towards recommending tablet responses. This change has led to inquiries from clients regarding whether altering the response method could impact the quality and content of answers. To address these concerns, we conducted a comparative study to examine the influence of response modes on survey outcomes.
Study Findings
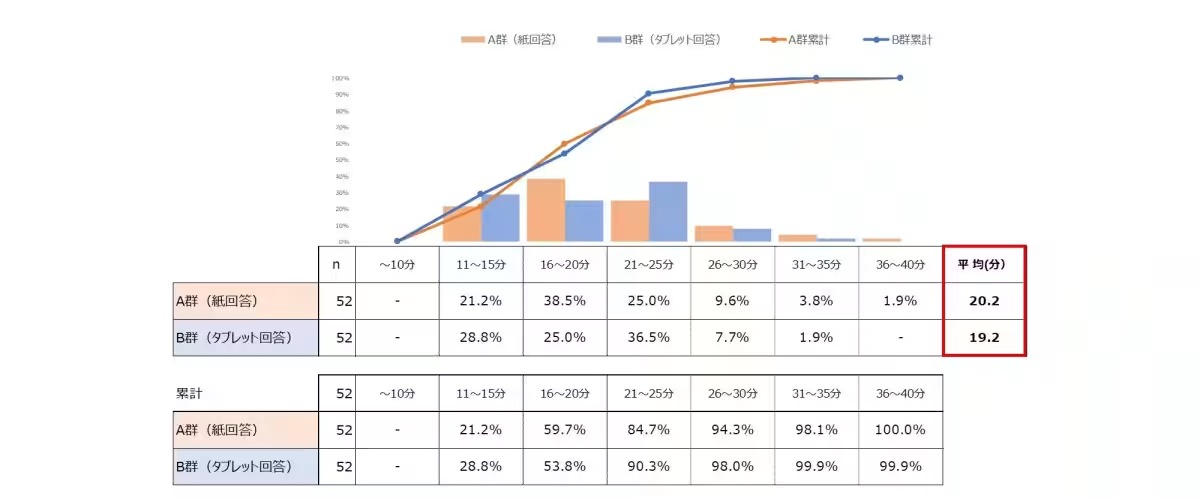
Response Time
The average response time was nearly identical for both methods, indicating that the mode of response does not have a significant impact on how long it takes participants to complete the survey.
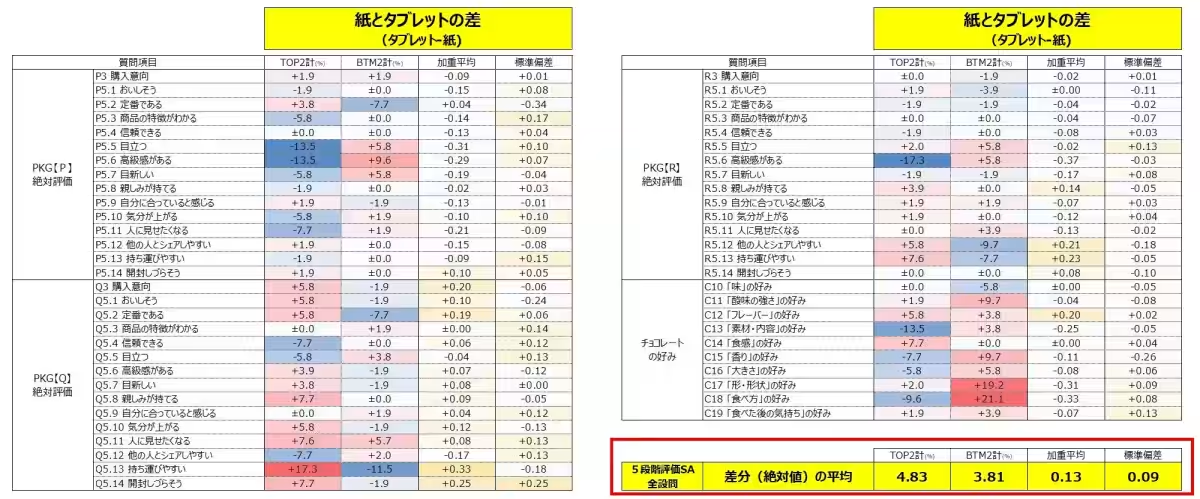
Single Answers (SA)
Overall, no evident bias was observed in the responses based on the method employed. While some questions displayed variations, the overall differences across all questions were minimal.
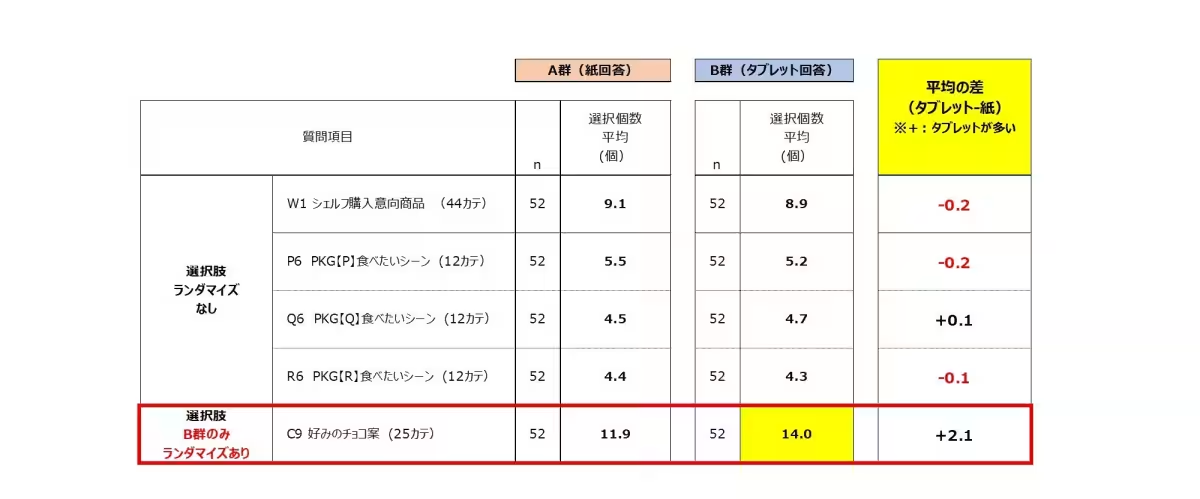
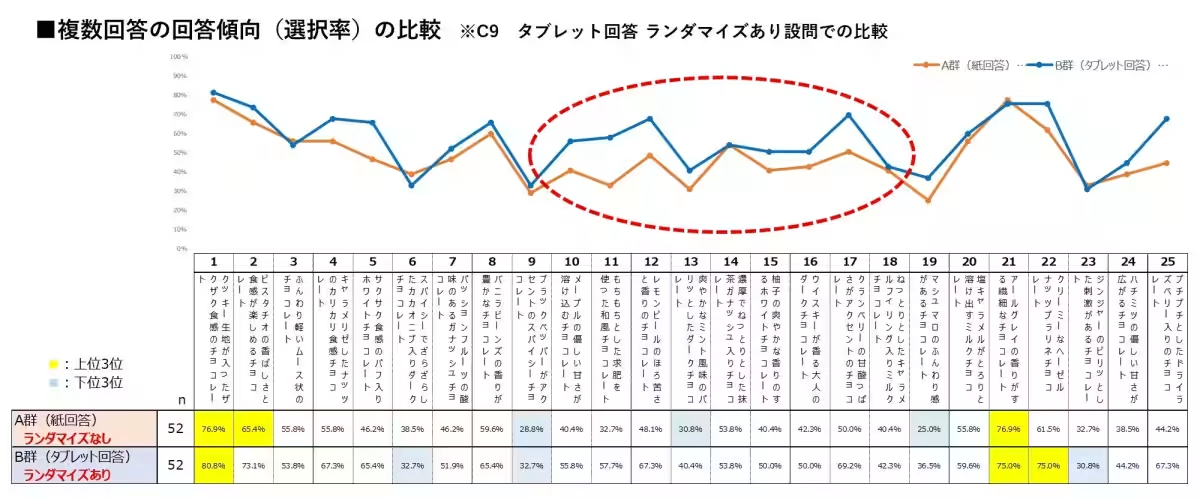
Multiple Answers (MA)
Under controlled, randomized conditions, the number of selections made by participants was comparable across both response modes. However, when randomized controls were applied to the tablet responses, there was a slight increase in the number of selected options. This approach reduced positional bias and enhanced the focus of respondents, ultimately improving the accuracy of their answers.
Open-Ended Responses (FA)
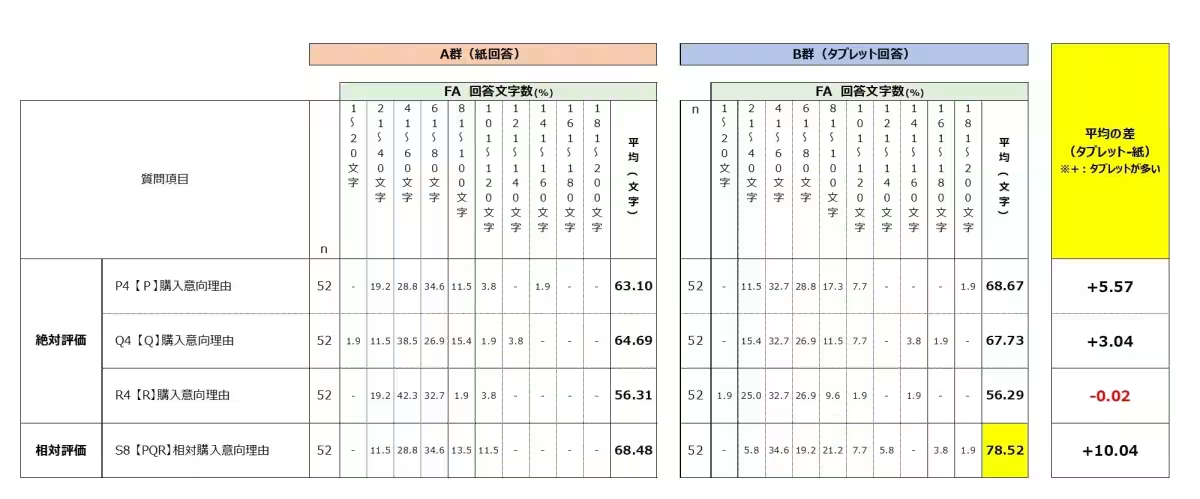
Participants who responded via tablet submitted longer answers on average. The ease of character conversion on tablets also led to a slight increase in content volume compared to paper responses.
Conclusion
The analysis showed that tablet responses did not significantly differ or show bias when compared to paper responses. Utilizing the system advantages such as response controls and device functionalities resulted in more accurate and substantial data outcomes.
Benefits of Tablet Responses:
- - Cost Efficiency: Reduced printing and data entry costs.
- - Convenience: Enables real-time progress tracking during data collection.
- - Speed Advantage: Shortened duration from data collection to results availability.
- - Functional Benefits: Future capabilities may include AI-based questions and interviews.
Given these insights and advantages, we encourage the consideration of tablet-based responses in future surveys.
Service Overview
Japan Information Inc. prides itself on being a leader in the industry for conducting CLT surveys. We frequently collaborate with manufacturers of consumer goods, performing numerous product tasting and packaging evaluations. For individuals seeking detailed explanations regarding our CLT surveys, please reach out via our corporate website.
Visit Japan Information Inc. Corporate Site
Study Overview
Study Method: This study utilized two groups responding to the same content: group A for paper surveys and group B for tablet surveys. By comparing the results from each group, we could analyze the effects of different response methods on the results.
Content of the Study: The survey focused primarily on product evaluations, specifically themed around chocolates and chocolate goods. Key questions included product assessments on shelves, evaluations of packaging, and questions on preferences and likings.
Target Participants: Women aged 20-60 from the Tokyo metropolitan area, both married and single, who consume chocolate and chocolate goods at least once a week. Individuals working in food manufacturing, media, advertising, or research roles were excluded from participation.
Group Design:
- - Group A: n=52 using paper responses
- - Group B: n=52 using tablet responses
Methodology: Central Location Testing (CLT) was conducted with pre-recruited participants.
Data Collection Date: July 10, 2025.
Inquiries for Materials
We are pleased to offer the report outlining the findings of this verification study at no cost. For interested parties, please request access through the following inquiry form: Request Report


Topics Consumer Products & Retail)


【About Using Articles】
You can freely use the title and article content by linking to the page where the article is posted.
※ Images cannot be used.
【About Links】
Links are free to use.