


Latest TikTok Shop Trends in Japan: December 2025 Market Report Reveals Growth Highlights
TikTok Shop Japan December 2025 Market Report
The Japanese market has shown impressive growth in TikTok Shop as outlined in the latest December 2025 report published by Live Commerce, a subsidiary of Vector Co., Ltd. With the use of the FastMoss analytics tool developed by Beijing Youluojin Technology Co., Ltd., the report reveals key sales data and trends that provide valuable insights into the TikTok Shop's performance in Japan.
Market Summary for December 2025
Key Sales Metrics
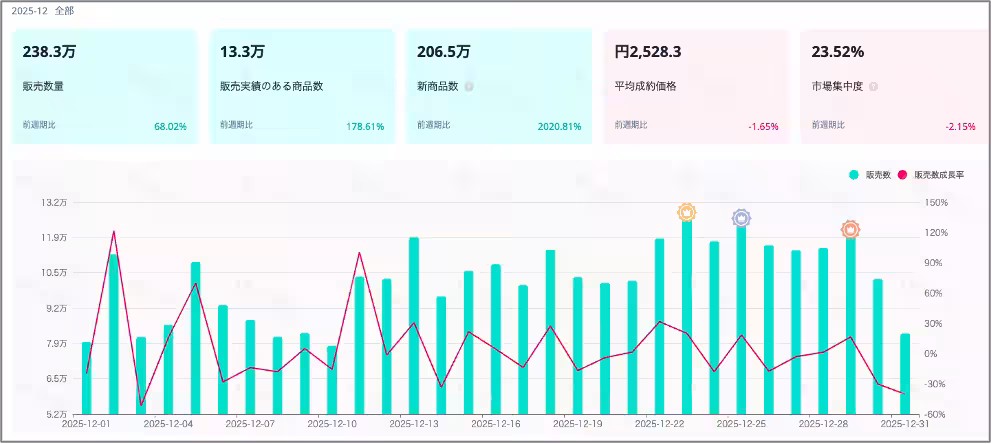
A comparative analysis of sales figures for December versus November 2025 highlights a significant increase:
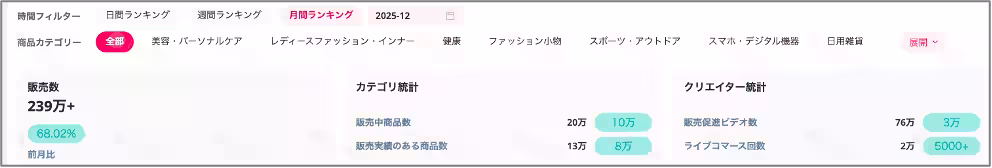
- - Units Sold: 2.383 million (up from 1.418 million, +68.1%)
- - Products with Sales Records: 133,000 (up from 48,000, +177.1%)
- - New Product Introductions: 2.065 million (up from 97,000, +2030.0%)
- - Average Selling Price: ¥2,528.3 (down from ¥2,570.7, -1.6%)
- - Total Sales Revenue Estimate: Approximately ¥6.02 billion, compared to ¥3.64 billion in November, reflecting a remarkable growth of over 65.4%.
The continuous rise in new product introductions coupled with seasonal promotional strategies, such as year-end sales led by the platform, has driven this substantial growth.
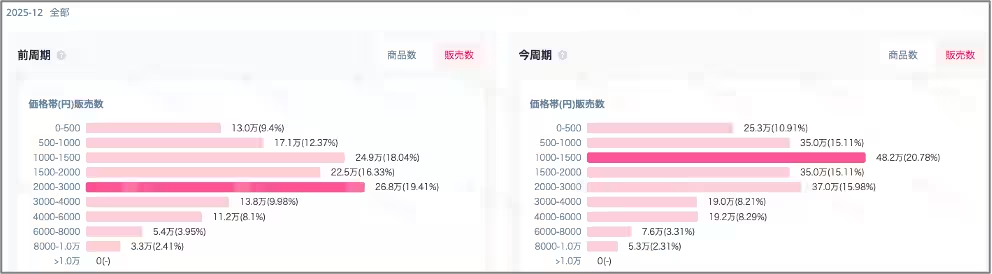
Product Pricing Distribution
In December, the most substantial sales segment by product price was once again observed in the low price range of ¥1,000 - ¥1,500, gaining a market share of 20.78%. Factors contributing to this trend include a surge in holiday shopping, particularly in the toys and hobbies category, with items like building blocks and Disney-themed toys seeing notable sales increases.
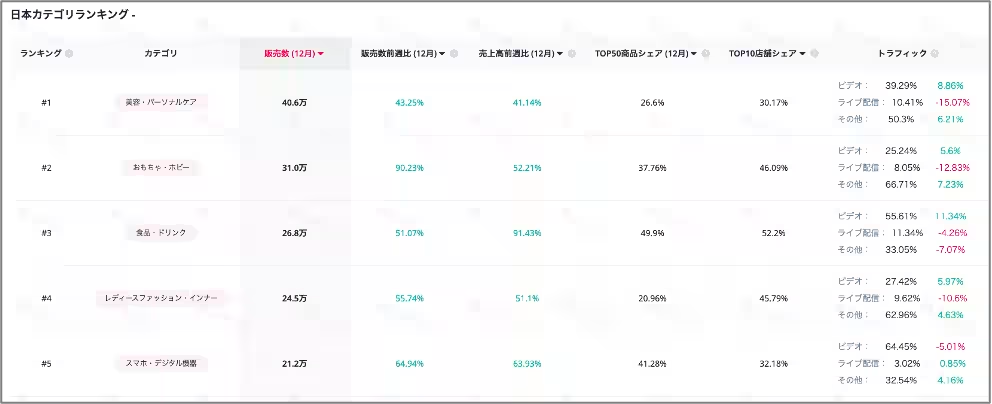
Top 5 Selling Product Categories
When evaluating the sales distribution by category for December:
1. Beauty & Personal Care: 406,000 Units (+43.5%)
2. Toys & Hobbies: 310,000 Units (+90.2%)
3. Food & Beverages: 268,000 Units (+51.4%)
4. Women's Fashion: 245,000 Units (+56.1%)
5. Smartphone & Digital Devices: 212,000 Units (+65.6%)
Overall, almost all major product categories recorded significant expansions in their sales volume, particularly during the holiday season, which further demonstrates TikTok Shop’s growing influence in the retail sector.
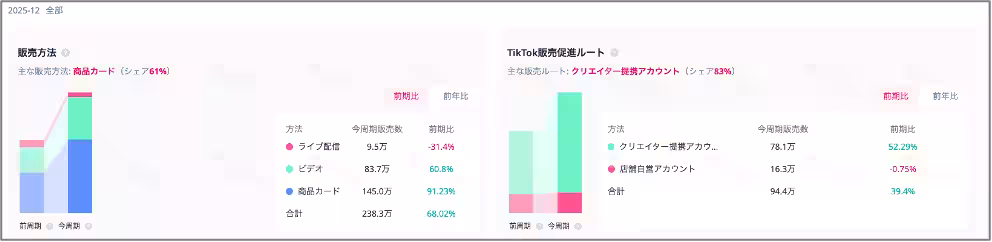
Sales Channel Insights
As per the report, the sales channels also evolved notably:
- - Live Commerce Sales: 95,000 units (down by 29.6%)
- - Video Sales: 837,000 units (up by 69.4%)
- - Product Cards: 1.45 million units (up by 84%)
This indicates a substantial shift towards shopping via video content and product cards, underlining a new retail landscape where short-form video content significantly drives consumer engagement.
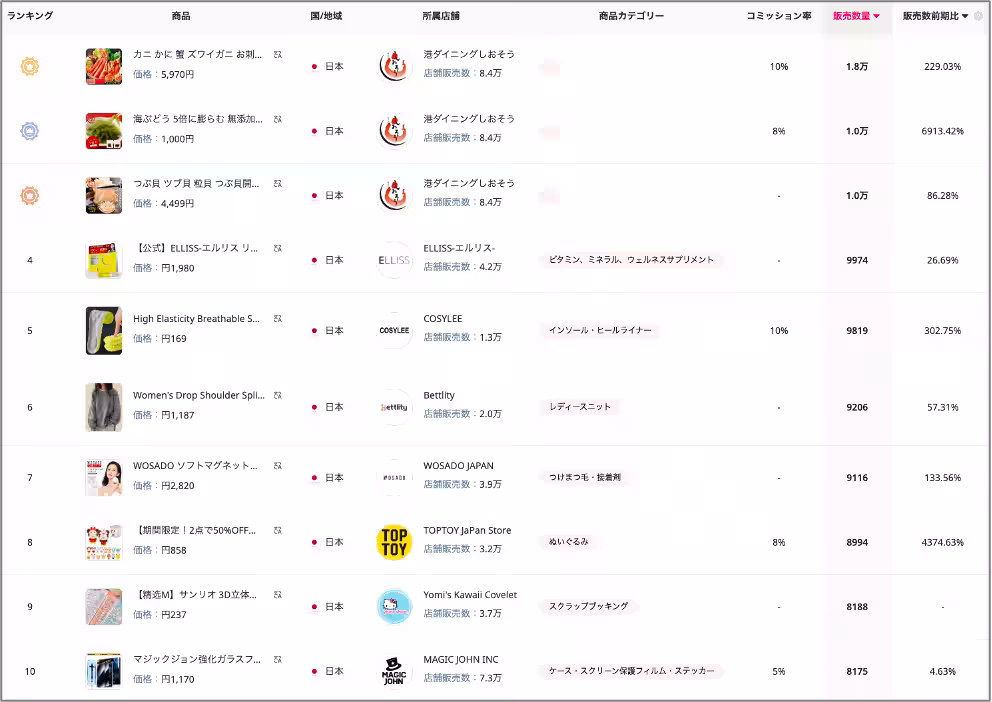
Ranking of Hot-selling Products and Stores
Prominent products in December included seafood such as crab and sea grapes sold by Minato Dining Shiosou, reflecting consumer preferences during the festive season. Conversely, previous best sellers dropped from the top rankings, signaling dynamic shifts in consumer buying behavior.
Insights on FastMoss Tool
FastMoss serves as a critical analytics tool for understanding TikTok Shop's market dynamics, making it invaluable for businesses aiming to optimize their sales strategies.
Conclusion
The December sales report underscores TikTok Shop’s rapid growth in the Japanese market, driven by effective marketing strategies and evolving consumer trends. As companies like Live Commerce leverage tools like FastMoss, the potential for sustained growth in the e-commerce sector remains robust.
For more detailed insights or to explore how FastMoss can benefit your business, visit FastMoss Pricing.


Topics Consumer Products & Retail)


【About Using Articles】
You can freely use the title and article content by linking to the page where the article is posted.
※ Images cannot be used.
【About Links】
Links are free to use.