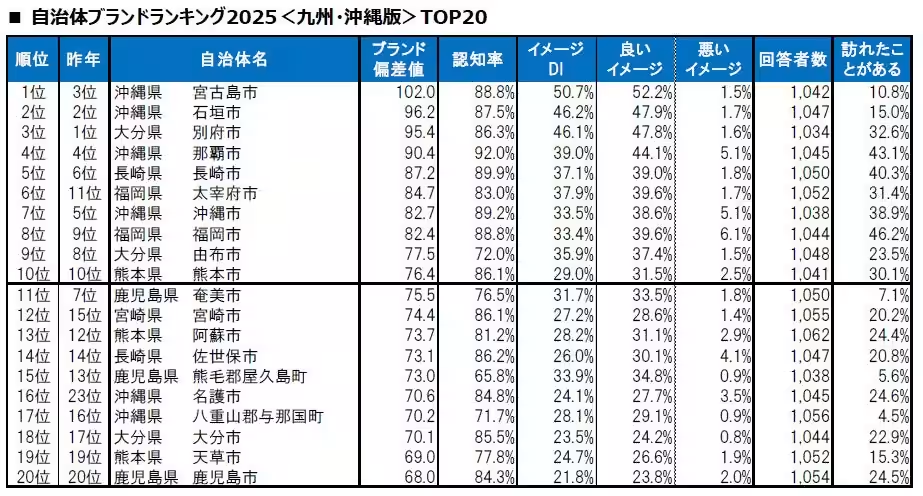
Discover the Rankings of Municipal Brands in Kyushu and Okinawa for 2025


Overview of the Survey
In a large-scale study, Daito Trust Construction Co., based in Minato, Tokyo, has unveiled the "2025 Municipal Brand Rankings for Kyushu and Okinawa." More than 180,000 responses were collected, making it a significant research effort. This year's brand evaluation is calculated using a unique approach termed "Brand Deviation Value," which takes into account the Image DI (the percentage of positive versus negative perceptions) multiplied by brand recognition.
Survey Details
Methodology
The research was conducted through an online survey distributed by Macromill, utilizing their registered panel of respondents. Participants included residents aged 20 and above from all 47 prefectures across Japan, specifically targeting 1,890 municipalities.
Respondent Demographics
The study achieved a balanced demographic representation:
- - Gender Ratio: 55.2% male, 44.8% female
- - Marital Status: 38.3% unmarried, 61.7% married
- - Children: 42.7% without children, 57.3% with children
- - Age Distribution: 8.9% in their 20s, 16.6% in their 30s, 22.9% in their 40s, 26.8% in their 50s, 18.1% in their 60s, and 6.6% in their 70s.
This diverse feedback pool allowed for a comprehensive analysis of public perceptions of municipal brands in the targeted regions.
Survey Period
Responses were collected from February 21 to March 10, 2025, aggregating a total of 182,805 participants.
Research Team
The project was coordinated by Ken Sou, a fellow at Daito Trust’s Rental Future Research Institute, with survey design, planning, and analysis being under his guidance, while Macromill managed the distribution and collection of the survey.
Respondent Engagement
Respondents were asked to evaluate municipalities randomly displayed from across Japan, excluding their place of residence. They selected from options such as:
1. I have lived there.
2. I have visited but have not lived there.
3. I have a positive perception.
4. I have a negative perception.
5. I only know the name without any particular image.
6. I have never heard of it.
The percentage values for selected options were compiled to form the Brand Deviation Value, derived from the Image DI (the positive perception rate minus the negative perception rate) multiplied by the recognition percentage. Notably, the summation of the responses indicating visits includes those who have both lived and visited the municipalities.
Usage Restrictions
Please note that all or portions of this release may not be reproduced or distributed without prior permission from the copyright owner, except for personal use under copyright law provisions. Media representatives, including newspapers, magazines, and broadcasters, are required to credit the source when reporting or quoting this release.
For academic research purposes, data from this survey may be available upon request. Detailed explanations and scholarly articles related to "Living Comfort Rankings" can be found on the associated website.
For more details, visit: Living Comfort Website and for the press release, click here: Press Release
Topics Consumer Products & Retail)


【About Using Articles】
You can freely use the title and article content by linking to the page where the article is posted.
※ Images cannot be used.
【About Links】
Links are free to use.