


Transforming Business Operations with Microsoft's New Copilot Usage Visualization Tool
Visualizing Microsoft 365 Copilot Usage for Enhanced Business Efficiency
In an age dominated by digital transformation, leveraging Microsoft's 365 Copilot effectively is more crucial than ever. Toyota Tsusho Systems Corporation (TTS) has introduced the new Copilot Usage Visualization Tool, aiming to address the challenges companies face in assessing how Copilot contributes to their operations. This tool is designed not just to confirm the adoption of Copilot but to measure its impact on driving business outcomes.
Understanding the Shift in Perspective
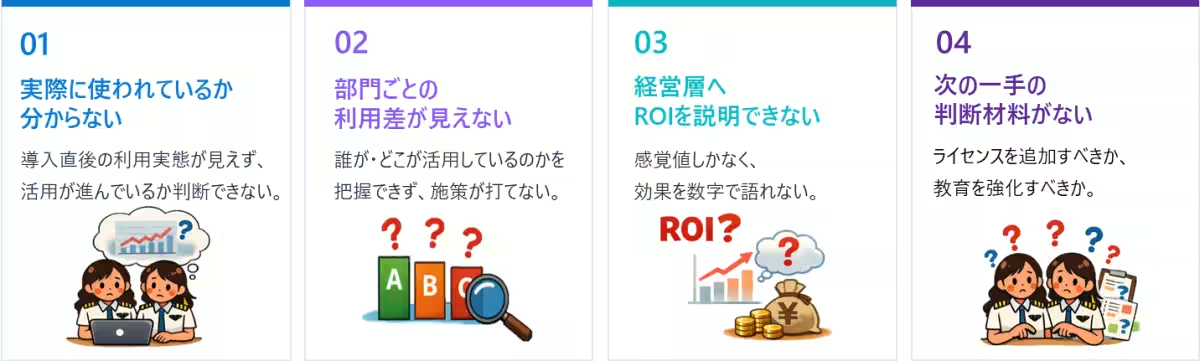
As organizations increasingly implement Microsoft 365 Copilot, a fundamental question arises: How much has business progressed as a result of this technology? Organizations have been struggling to provide answers about the productivity enhancements brought by Copilot. Many have discovered that the effectiveness of Copilot usage is often left unmonitored, resulting in a performance gap in understanding its utilization across the company.
With the Copilot Usage Visualization Tool, companies can transition from merely questioning whether Copilot was adopted to comprehensively analyzing its effectiveness in actual business processes. This shift emphasizes understanding where enhancements in operations can occur and preparing for the next steps in improving those areas.
Data-Driven Decisions for Copilot Utilization
The Copilot tool supports various business functions, including email drafting, meeting summaries, document creation, presentation development, and data analysis. However, the focus should not be solely on confirming usage but rather on answering critical questions:
- - Which departments actively use Copilot?
- - What specific tasks are being enhanced?
- - Where are the most significant growth opportunities for user adoption?
- - How much time savings can be attributed to Copilot?
- - What areas require additional training and support?
The visualization tool provides users with data represented on a Power BI dashboard, enabling organizations to assess their Copilot usage and connect insights to actionable decisions, such as operational reporting, feedback mechanisms on the ground, training initiatives, resource allocations, or investment strategies.
Detailed Insights Offered by the Tool
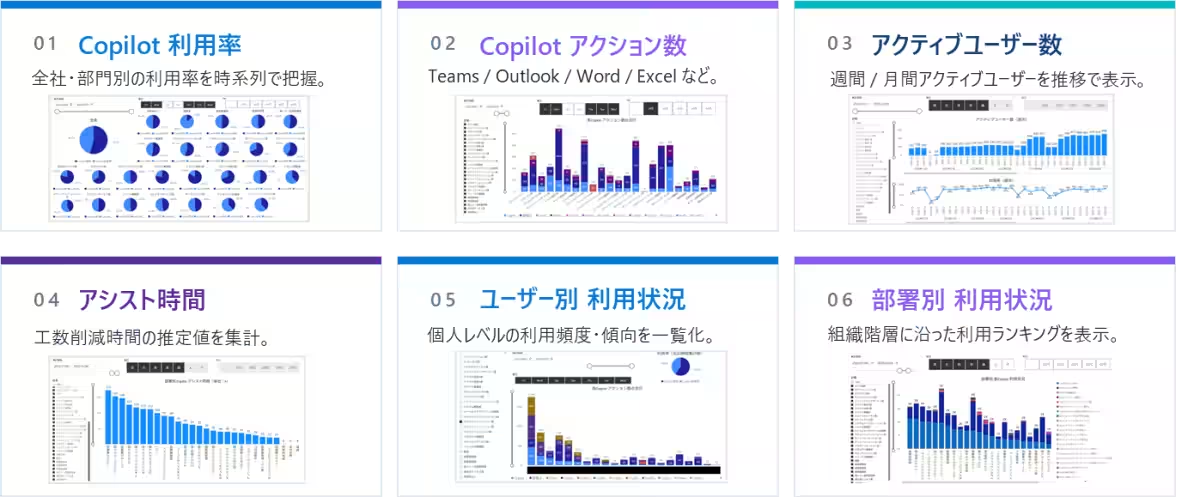
The Copilot Usage Visualization Tool displays various metrics on a centralized dashboard:
- - Number of active Copilot users and utilization rates
- - Action counts segmented by application and department
- - Trackable assist time reflecting actual time saved in operations
- - Historical data trends to observe patterns over time
These insights equip organizations to be in a position where they can effectively explain Copilot's contribution towards business improvements with tangible data.
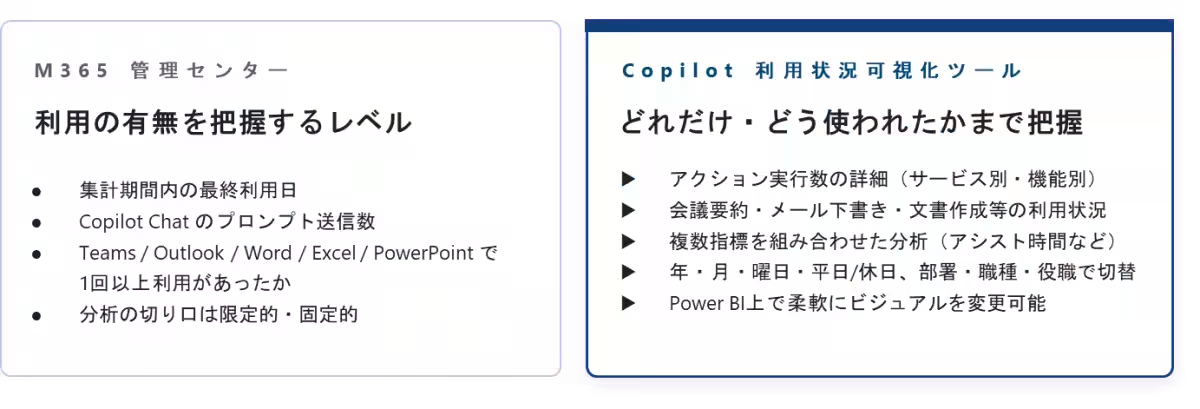
Distinction from Microsoft 365 Admin Center Reports
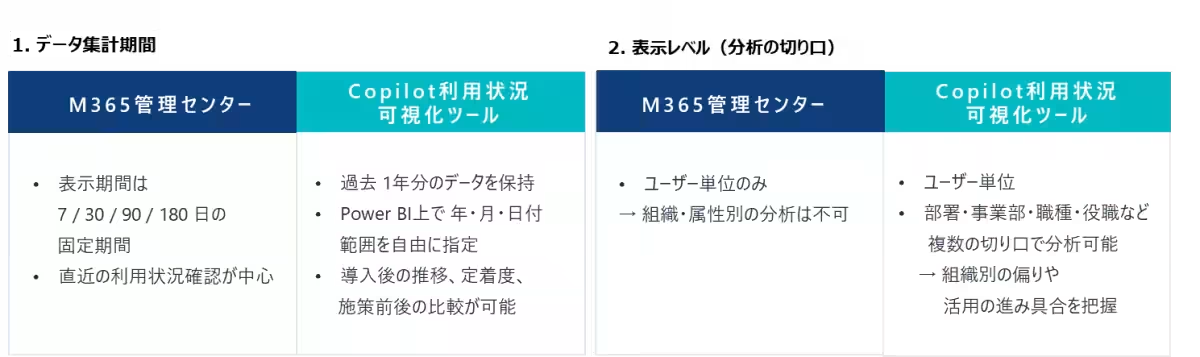
While organizations can get a glimpse of Copilot usage from the Microsoft 365 Admin Center, this level of insight is insufficient for fostering deep integration of Copilot.
TTS's new tool goes beyond basic usage tracking by providing information crucial for understanding whether continued investments in Copilot are warranted. If the Admin Center is geared toward assessing usage, this tool serves as a foundation for visualizing Copilot utilization, allowing organizations to interpret the data and implement strategies for enhancement.
Practical Applications of the Visualization Tool
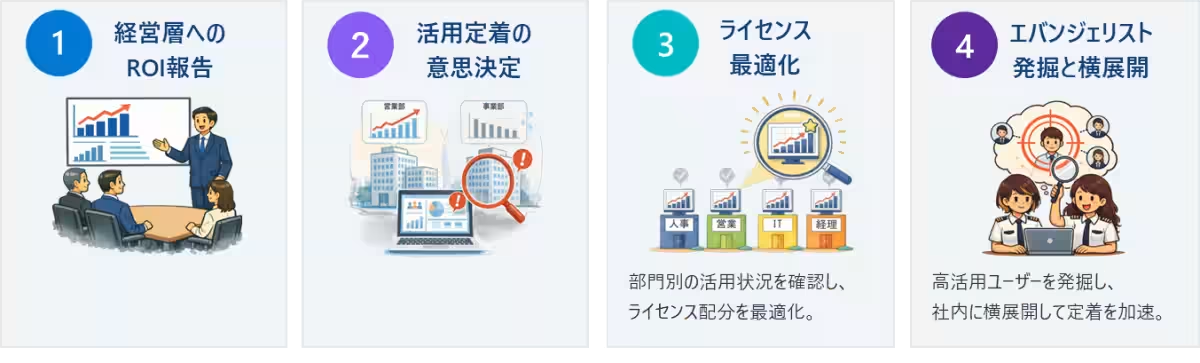
The Copilot Usage Visualization Tool can be particularly beneficial in several scenarios:
1. ROI Reporting for Executives: By visualizing usage stats and assist times, it can serve as a resourceful tool for reporting insights to upper management, detailing how extensively Copilot is employed and its effectiveness across departments.
2. Facilitating Adoption by DX Drivers: The adoption of digital transformation demands regular assessments. This tool allows DX teams to revisit usage statistics periodically, adjusting education and internal roll-out strategies accordingly.
3. License Optimization for IT Departments: Since Copilot licenses represent a significant investment, it’s critical for IT to ensure maximum utilization post-implementation. The visualization tool provides insights on user adoption at a granular level, aiding in decisions about resource allocation.
4. Identifying Potential Evangelists: By gaining visibility on frequent users of Copilot and those harnessing specific features effectively, companies can spot potential internal advocates to foster a broader and more practical use of the tool.
A New Era of Continuous Improvement
Understanding that implementing Copilot is merely the beginning, companies must focus on how this tool transforms daily roles, evolving workflows, and culminating in measurable results. The Copilot Usage Visualization Tool acts as a navigator in this journey, offering clarity on current utilization and guiding future actions.
With TTS's commitment not just to assisting in the adoption of Microsoft 365 Copilot but also in fostering sustained engagement, measurement of effects, and continuous enhancements, this tool is poised to enhance the overall effectiveness of AI integration within corporate environments.
For inquiries, reach out to Toyota Tsusho Systems Corporation’s Cloud Solutions division via their contact page: Contact Us
Company Overview
- - Name: Toyota Tsusho Systems Corporation
- - Founder: Founded in 1994
- - Location: Nagoya City, Aichi Prefecture, Japan
- - Representative: President Hiroshi Watanabe
- - Website: Toyota Tsusho Systems


Topics Business Technology)


【About Using Articles】
You can freely use the title and article content by linking to the page where the article is posted.
※ Images cannot be used.
【About Links】
Links are free to use.