


Innovative Weather Visualization Technology Set to Enhance Typhoon Predictions and Rainband Forecasts
Japan Meteorological Association and Waseda University Launch New Weather Visualization Trial
On June 15, 2026, the Japan Meteorological Association, headquartered in Toshima, Tokyo, and Waseda University, located in Shinjuku, Tokyo, will commence an experimental trial of an innovative weather visualization technology developed by Associate Professor Asei Teduka of Waseda University's Faculty of Science and Engineering. This technology aims to represent the temporal changes and movement trends of weather phenomena on a single static image, significantly enhancing the clarity and comprehension of weather forecasts.
Purpose of the Experiment
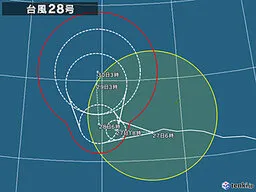
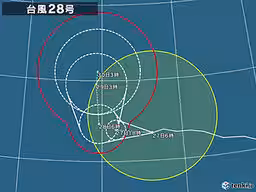
The trial will primarily focus on the prediction circles of typhoons and the forecasts of linear precipitation zones. It aims to validate the effectiveness of a representation method that allows for a quick and intuitive grasp of differences in positions and ranges at various time intervals, as well as the characteristics of stagnation, movement, and development.
Background
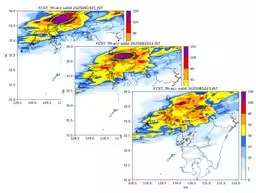
Conveying meteorological information effectively faces the challenge of representing variations over time and capturing the spatial movements of phenomena on limited media. For instance, when a typhoon stagnates, multiple forecast circles can overlap, making it difficult to distinguish which time each circle denotes. Similarly, the forecasts for linear precipitation zones are often expressed through several diagrams for different time points, complicating the communication of their occurrence, movement, and stagnation trends on a single static image.
Details of the Experiment
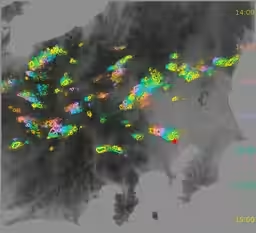
This new visualization technology layers the historical data and movement trends of weather phenomena for a holistic view on a static image. By using color to indicate changes over time and line thickness to represent the intensity of phenomena, it aims to provide a user-friendly display that allows individuals to quickly comprehend the trends related to dangerous weather phenomena such as their movement, stagnation, and development.
As part of the experiment, the following aspects will be evaluated regarding the visibility and clarity of weather information:
- - Is it intuitive to understand the differences in position and range at different times?
- - Are stagnation, movement, and development trends communicated clearly?
- - Does it cater well to users of “tenki.jp” and fulfill the needs for journalistic or explanatory purposes?
- - Can we expect enhanced visibility and understanding on social media and in articles?
Potential Applications
Beyond typhoon forecast circles and linear precipitation zones, this technology holds the potential for application in displaying the movement history of thunderclouds. By layering the positions, movement directions, and intensity variations of thunderclouds over time on a single static image, it can facilitate a more intuitive understanding of their movement history and future trends.
Future Developments
Looking ahead, the Japan Meteorological Association and Waseda University will continue to explore various aspects of the presentation method, such as color schemes, legends, time presentations, and overall visibility. During the rainy season of 2026 (June to September), they plan to trial the use of images employing this visualization technology to provide explanations of typhoon information and forecasts of linear precipitation zones on “tenki.jp.”
After the initial release, feedback will be collected from social media responses, surveys from article audiences and users, interviews with meteorological experts, and comparisons with traditional formats. These evaluations will help assess improvements in visibility and understanding, ensuring that communicating the time changes in typhoon forecast circles and linear precipitation zones on a static image is both effective and enhances audience engagement with disaster prevention measures and improved comprehension in reporting and analysis.
Additionally, further considerations regarding this visualization technology will include exploring its applicability to other weather phenomena.
Topics Other)


【About Using Articles】
You can freely use the title and article content by linking to the page where the article is posted.
※ Images cannot be used.
【About Links】
Links are free to use.