


Revolutionizing Market Analysis with Real-Time Crypto Canvas
Introduction
In an age where cryptocurrency is becoming increasingly prevalent, grasping the vast amounts of information available can be overwhelming. Thesis.io has recognized this challenge and has released Crypto Canvas, a groundbreaking real-time market map interface designed to streamline cryptocurrency market analysis for traders. This innovative tool allows users to visualize market patterns and trends, facilitating faster decision-making in a dynamic environment.
What is Crypto Canvas?
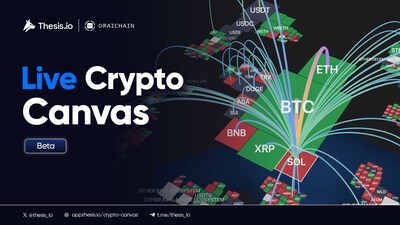
Crypto Canvas is an interactive market visualization tool that is systematically updating to reflect real-time data from the cryptocurrency space. Unlike traditional data visualization tools that offer segmented data slices or scattered trending graphs, Crypto Canvas consolidates information from over 4000 Web3 projects and more than 130,000 prominent cryptocurrency influencers into a single, coherent format. By doing so, it transforms a chaotic stream of information into an organized, digestible format for immediate analysis.
Key Features
- - Real-Time Data Integration: Users can view instantly updated information, including price metrics, trading volumes, and market capitalizations.
- - Comprehensive Market Overview: The platform allows users to visualize all critical signals at once, offering a context-aware snapshot of the market landscape. This is achieved through the innovative representation using tiles, each indicating various data points, sizes, and market movements, effectively displaying multiple dimensions of data within a single view.
- - Enhanced Interaction: Users can quickly interact with various elements on the map—clicking on individual tiles reveals a deeper dive into specific project insights. From market trends to sentiment indicators of influencer activity, Crypto Canvas keeps users informed and agile.
Why Traders Need Crypto Canvas
As traders navigate the complexities of the cryptocurrency market, the need for timely decisions is paramount. With liquidity often being established before detailed historical records are maintained, Crypto Canvas offers a way to recognize potential entry points through its visual representation of market clusters and heat pockets. The unique visualization feature allows traders to spot correlations between moving averages and influencer interactions, enhancing their tactical approach to buying, selling, or holding assets.
Real-Time Analysis
A key advantage of Crypto Canvas is its capability to keep pace with the fast-moving cryptocurrency landscape. By tracking simultaneous changes in the market, traders gain an opportunity to see whale activity and react swiftly to price movements. With fixed views that maintain clarity for comparative analysis across tokens and sectors, the platform provides a high-level perspective while accommodating deeper explorations of individual tiles as new data unfolds.
Conclusion
Currently in open beta testing, Crypto Canvas is a pioneering solution that aims to set a new standard for visualizing and analyzing complex cryptocurrency data. Its user-friendly interface and real-time updates make it an indispensable tool for anyone involved in cryptocurrency trading. By providing an at-a-glance view that aggregates critical data points, users can swiftly adapt to changes and maintain a competitive edge in the ever-evolving market landscape.
Explore Crypto Canvas today to unlock new possibilities in your trading strategies, and stay ahead of the curve in the fast-paced world of cryptocurrencies.
Topics Business Technology)


【About Using Articles】
You can freely use the title and article content by linking to the page where the article is posted.
※ Images cannot be used.
【About Links】
Links are free to use.