



Recent Update on Regional Promotion Dashboard for Local Products Released Free to the Public
Latest Update on the Regional Promotion Dashboard for Local Products
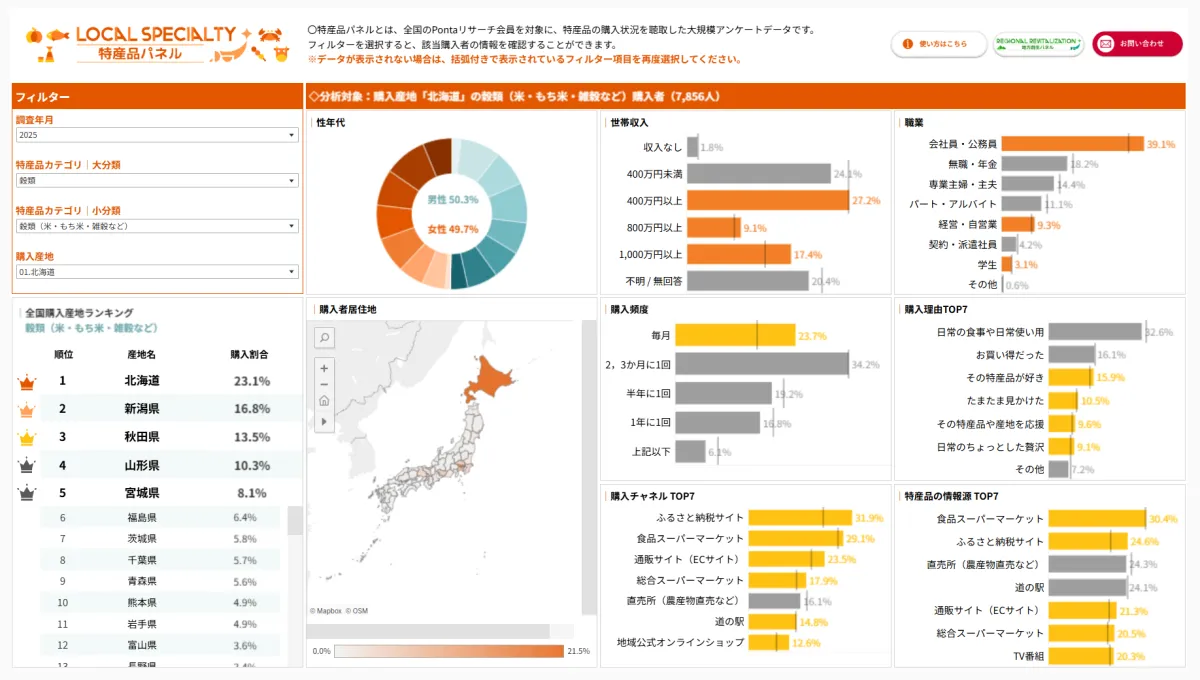
Loyalty Marketing Co., Ltd., based in Shibuya, Tokyo, has announced the free release of new data on the "Regional Promotion Dashboard for Local Products" on July 31, 2026. This innovative tool visualizes the purchasing trends of local products, allowing users to understand various aspects like purchasing locations, buyer demographics, and channels of purchase. The dashboard is hosted on the data visualization platform Tableau Public.
What is the Regional Promotion Dashboard?
The dashboard is a free tool that provides visualized survey data regarding local products gathered from Ponta Research members. By selecting specific categories or areas of local products, users can view attributes of the purchasers, their motivations for buying, and the channels through which they make purchases. It primarily serves municipalities and organizations involved in regional revitalization that wish to understand purchase patterns and buyer profiles to enhance marketing strategies for local brands.
With the recent update, data from the latest survey conducted between November 12, 2025, and January 5, 2026, has been made available. The categories of local products have increased from 13 to 57, significantly enhancing the granularity of the data. For instance, instead of a single category labeled "meat," there are now detailed classifications for "beef," "pork," and "chicken." Additionally, the dashboard now includes new fields for tracking the residences of purchasers and the information sources they consulted during their purchase decision.
This enhanced capability allows stakeholders to analyze whether local products are predominantly purchased within their regions or if there’s a spread to other prefectures. Understanding which information sources contribute to purchasing decisions is invaluable for strategic marketing.
Benefits of the Dashboard
Loyalty Marketing aims to support businesses in overcoming marketing challenges through this dashboard and the analysis of over 100 million Ponta members' data. The dashboard follows the Ponta membership regulations, individual privacy laws, and other applicable guidelines ensuring data management standards are upheld.
Here are some of the features and insights visitors can explore:
- - National Purchase Origin Rankings: Displays a ranking of the primary regions where products are purchased.
- - Buyer Demographics: Offers insights into the demographics of purchasers based on their selected categories and origins.
- - Buyer Residences: Maps out where buyers are located in relation to their selected product categories.
- - Purchase Patterns: Illustrates the frequency of purchases, reasons behind those purchases, channels, and sources of information relied upon.
Real-world Application of Data
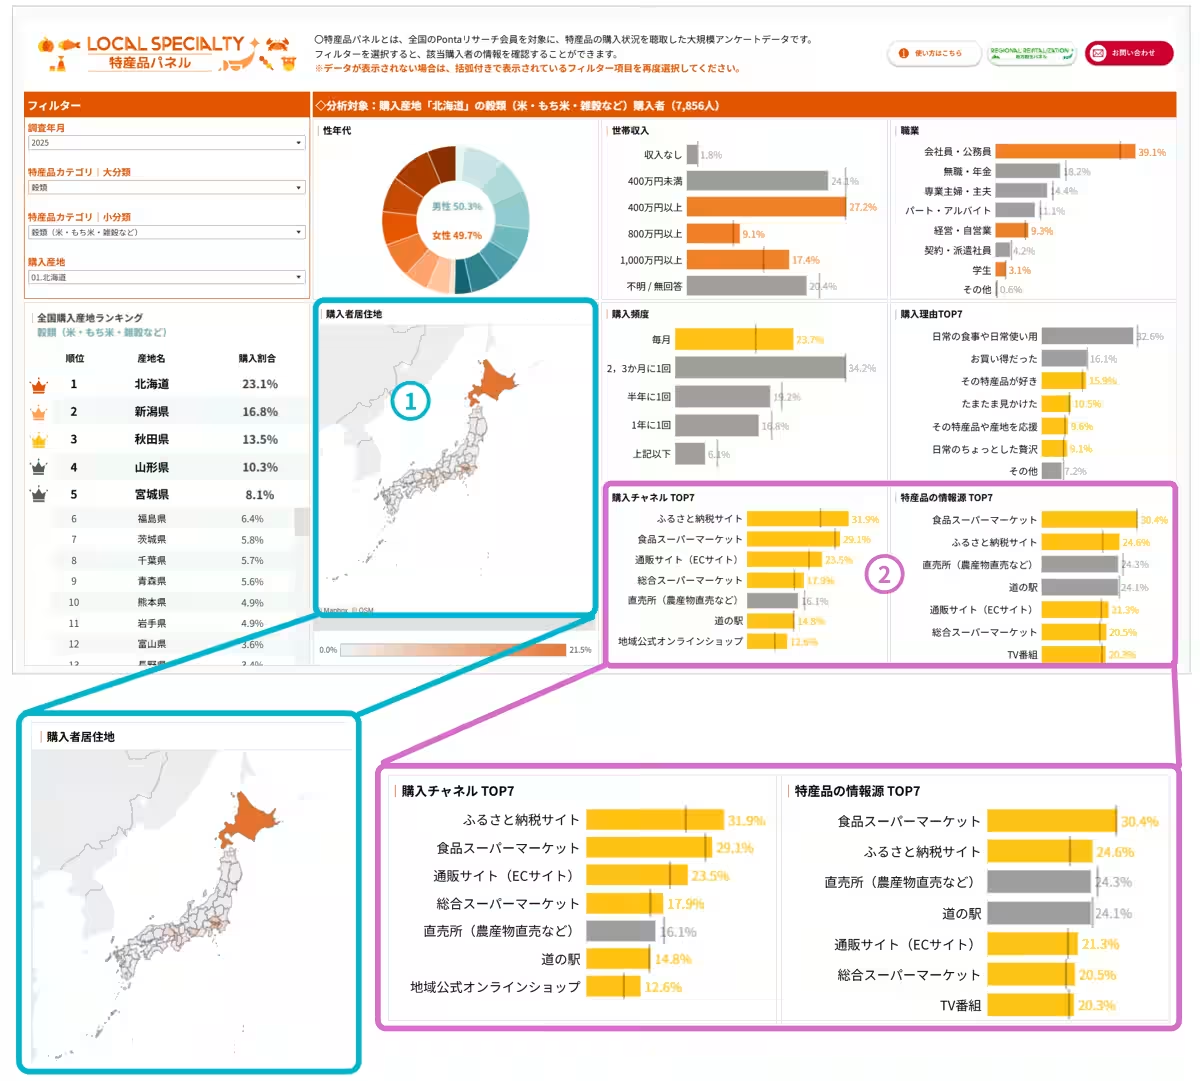
Let's consider a query: "Where are Japan’s local grains (like rice, mochi rice, and millet) from Hokkaido being recognized and purchased nationwide?" The analysis reveals that buyers primarily reside in Hokkaido but have expanded into other regions, indicating a broader market reach. Importantly, purchase channels and information sources indicate that platforms like hometown tax donation websites significantly contribute to buyer engagement.
Further Research and Promotion Possibilities
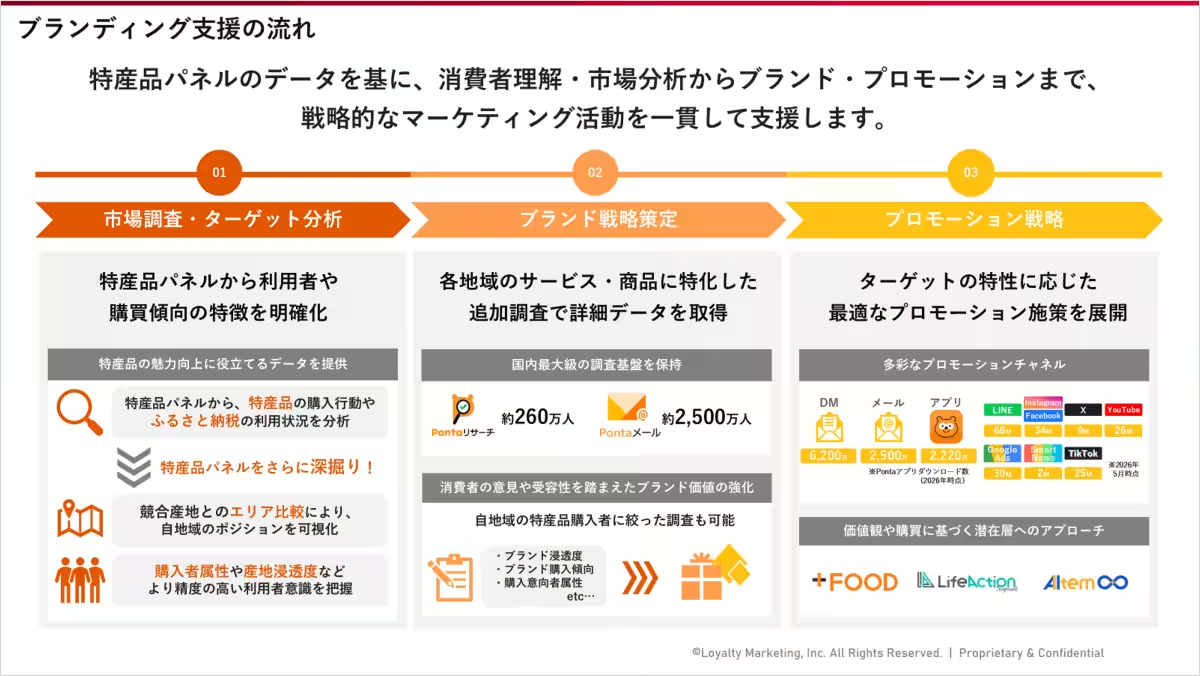
Organizations can further explore trends identified in the dashboard by conducting additional research into specific regions or local products. For example, they could investigate the reasons why buyers from outside Hokkaido express interest, focusing on factors such as taste, quality, and price. With these findings, targeted promotional strategies can be developed using channels such as Ponta emails and apps to effectively reach potential buyers.
Survey Overview
- - Target Audience: Ponta Research members aged 15 and above.
- - Methodology: Web-based surveys.
- - For the 2024 dataset: Survey Period: Nov 22, 2024, to Jan 14, 2025, with 158,676 responses.
- - For the 2025 dataset: Survey Period: Nov 12, 2025, to Jan 5, 2026, with 139,529 responses.
Data has been weighted based on national demographic statistics to ensure accuracy.
The Regional Promotion Dashboard can be accessed at this link for anyone interested in in-depth insights regarding local products.
Topics Consumer Products & Retail)
【About Using Articles】
You can freely use the title and article content by linking to the page where the article is posted.
※ Images cannot be used.
【About Links】
Links are free to use.